

May CPI & Jobless Claims Trends
May core inflation was weaker than expected; trimmed mean measures also eased. Going into June initial jobless claims still pointed to more layoffs.

This post reviews trends from the most notable data releases this past week: the May CPI report as well as this week’s jobless claims trends.
Key takeaways:
Core CPI inflation was weaker than expected in May with trimmed mean CPI measures continuing to suggest that in terms of underlying PCE inflation, trends remain sticky above the Fed’s inflation target.
Initial jobless claims continue to tick up but remain at relatively low levels. But continued claims are rising and more elevated compared to recent years. Historically low net hiring and strong population growth recently means that relatively low initial claims do not signify a tight labor market and recent trends suggest a buildup in upside unemployment risks.
The recent data suggest that while the unemployment rate likely will grind higher, the Fed will remain on hold for a while given the underlying inflation trend as well as the expected inflationary impact of import tariff hikes.
May CPI: Easing for Now
The topline numbers of the May CPI report were (again) below consensus expectations: headline CPI was up 0.1% (forecast: +0.2%) over the month in May after increasing 0.2% in April, while core CPI was also +0.1% month/month (three-digits: +0.130 vs. +0.237 in April; forecast: +0.3%).
To assess underlying CPI inflation, a look at the Cleveland Fed's trimmed mean CPI measures is useful, as these strip out volatile elements using either the median (price change at the 50th percentile) or a 16% trimmed mean (weighted average excluding the top and bottom 8% of price changes). Unlike previous months, when it hovered around +0.3% m/m, the Median CPI eased in May: +0.22% vs. +0.33% in April. Similarly, the 16% Trimmed Mean CPI slowed from +0.25% to +0.18%. YTD, these measures are averaging +0.3% m/m—stickier than the +0.15% for core CPI.

A key driver remains Rent and OER: CPI Rent of Shelter inflation decelerated to +0.3% month/month from +0.4% in April. Year/year OER rates across Census regions show that this easing was likely driven by a notable easing in OER inflation in the Northeast, even though OER inflation accelerated in the West (chart above). Apart from the West (where OER is re-accelerating), year/year OER inflation remains stable above pre-COVID levels in the Midwest, Northeast, and South. It thus remains to be seen if a nationwide return to pre-COVID trends is in store this year. Also note that while housing services drive ~40% of core CPI, they account for under 20% of core PCE—the Fed’s preferred price gauge. So, disinflation must be broader based, and the trimmed mean metrics suggest that this is only the case very recently.
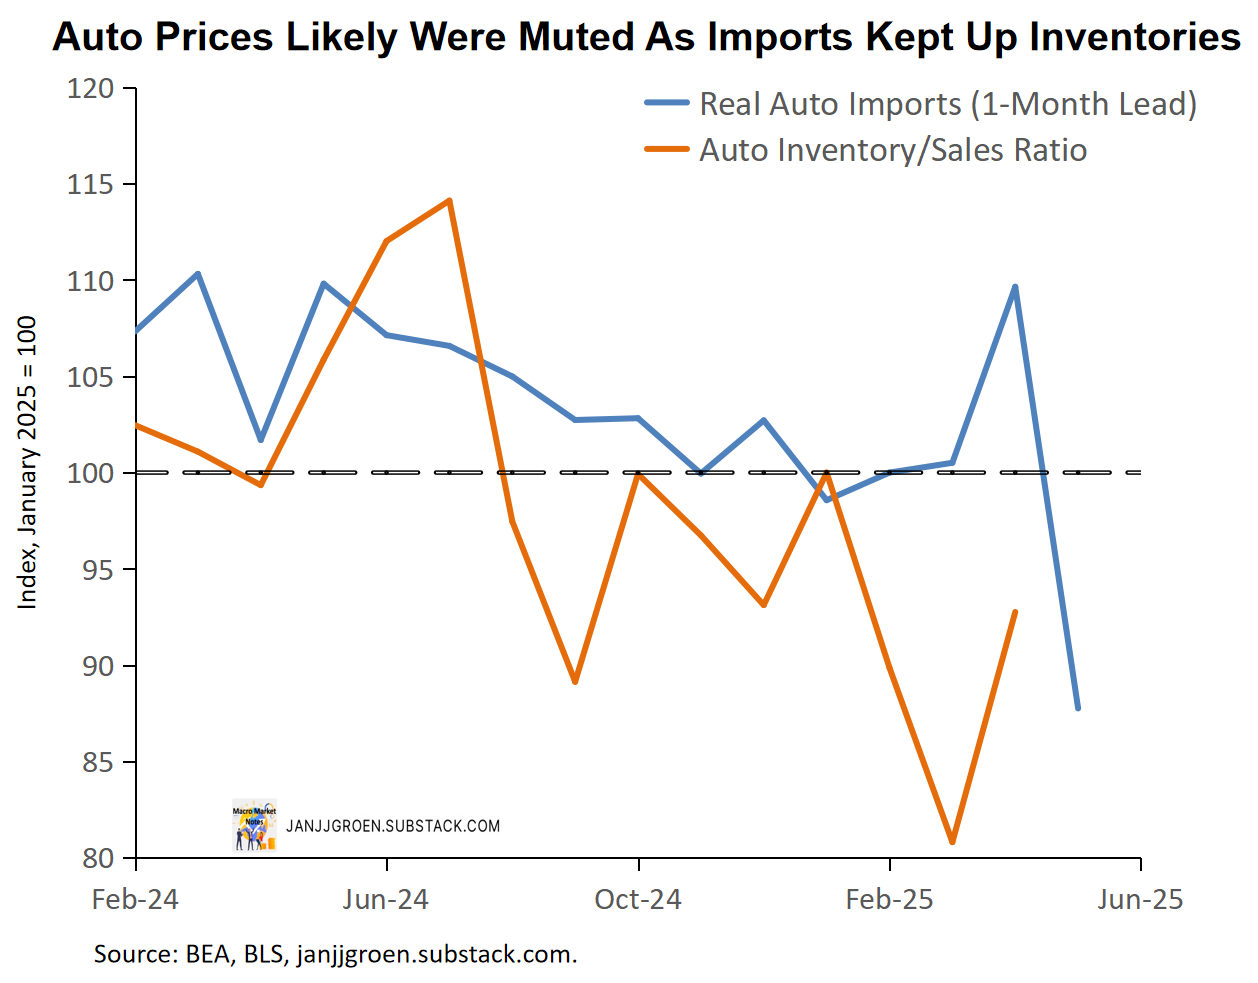
Core goods in CPI declined marginally in May by -0.04% m/m, mainly due to a -0.3% drop in the new and used cars component. The “Liberation Day” tariff hikes announced in April and the anticipation ahead of them spurred strong Q1 consumer spending, imports and inventory builds, especially in cars (chart above). Real (auto) imports then collapsed after Q1, which suggests that once retailers deplete pre-tariff inventory steeper future price passthroughs are to be expected later this year.


With still sizeable pre-tariff hike inventories and an effective tariff rate that still does not full reflect the end-result of the announced (and amended) tariff hikes (first of the two charts above), sharply higher goods inflation in May was not expected. With trade policy uncertainty continuing, rolling price increases are more likely through year-end. Indeed, some tariff-sensitive CPI categories outside of cars have shown sustained price hikes since April (second of the two charts above).
Both the Median CPI and 16% Trimmed Mean rates are overshooting the Fed's 2% inflation target over six months (around 3% in core PCE terms), though both have eased gradually in the last two months (chart above).
Statistical nowcasts using the strong CPI-PCE trimmed mean correlation suggest May's underlying PCE inflation trends (which are due later this month) stayed elevated, around 2.7% in core PCE terms (diamonds in the above chart).
These nowcasts indicate inflation trends remain well above the Fed’s 2% target. With core inflation likely rising again later this year due to tariff effects, the Fed will probably stay on hold—likely for the rest of the year.
This Week’s Initial Jobless Claims Trends
Initial claims for the week ending June 7th remained stable compared to the preceding week and stood at 248,000 persons.
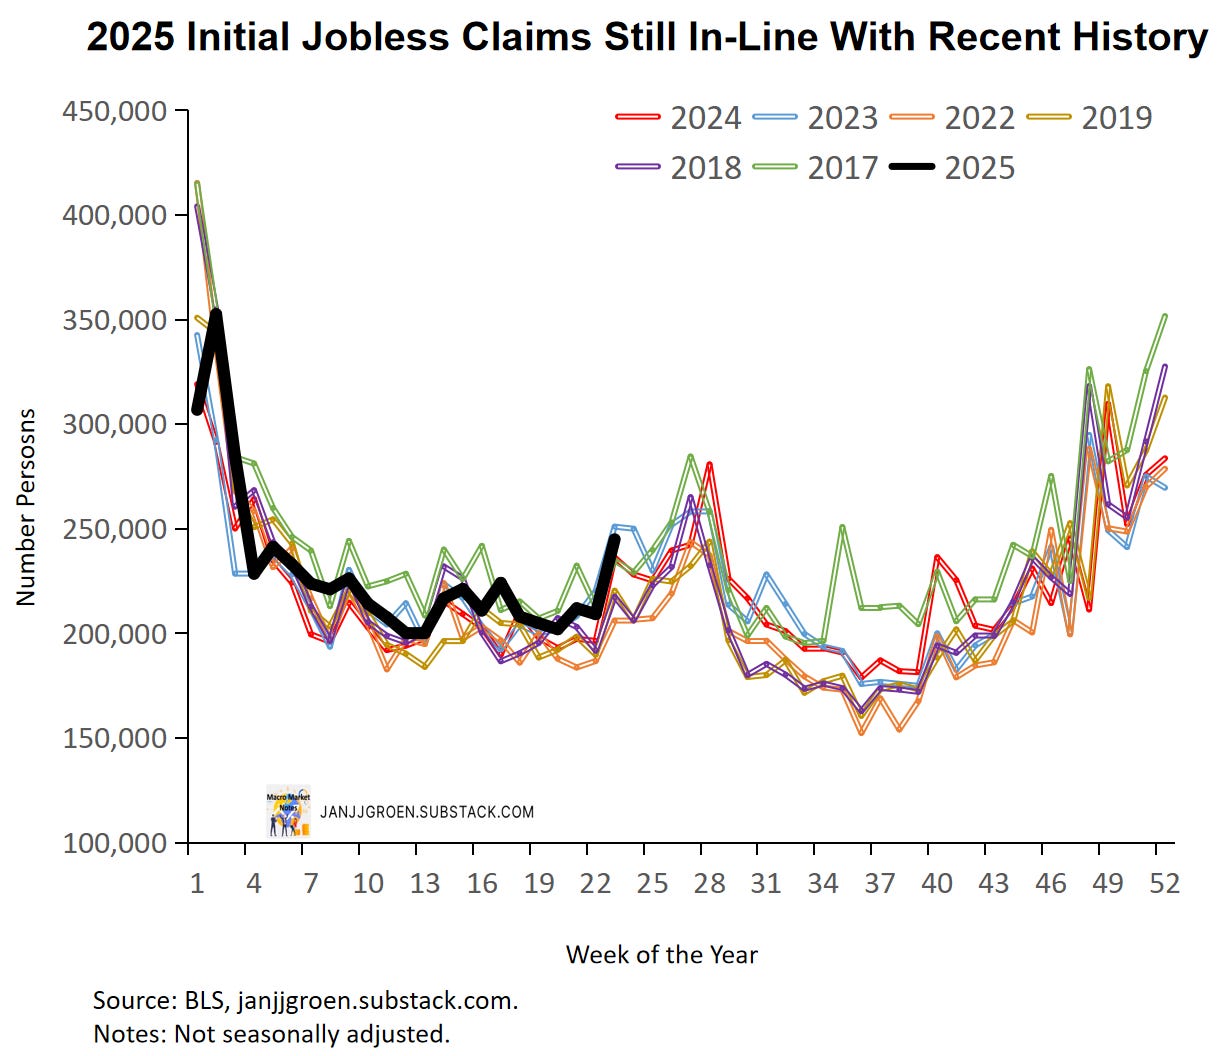
When I focus on non-seasonally adjusted data and compare the data for the week ending June 7 with data from previous years in the same week it suggests initial claims recently have in line with the typical dynamic of this time of the year, especially compared to 2023 (chart above).

Similar (i.e. non-seasonally adjusted) data for continued claims (people who claim unemployment benefits for more than a week) scaled by the number insured workers indicate that compared to recent years, the relative number of longer unemployed people has been relatively elevated and continues to rise (chart above). It confirms hiring and quits data from JOLTS indicating that net hiring currently is historically low.
In terms of the unemployment outlook, initial claims are usually considered as a high frequency, real-time indicator of layoffs. What is relevant in that context is whether the layoff rate as implied by initial claims is significantly high or low to put substantial upward or downward pressure on the unemployment rate. To assess this, I laid out earlier a methodology to determine a benchmark rate for initial claims for the current month that equals the maximum number of initial claimants that will keep the unemployment rate constant relative to the previous month.
This claims benchmark number is positively correlated with net hiring (hiring minus quits and retirements) and the take up rate (initial claimants as a percentage of layoffs) and negatively correlated with the breakeven pace for payrolls growth (which depends positively on projected labor force growth) given last month’s unemployment rate. If current initial claims rise above this claims benchmark rate, initial claims could potentially start to add to the unemployment rate.

I also compute a claims benchmark rate that incorporates the CBO’s more aggressive population projections for 2020-2025 instead of the Census projections used by the BLS. This CBO population projection reflects the 2025 update published on January 13, which incorporates stronger net immigration estimates than the Census estimates used by the BLS, as well as a 0.9% population growth rate for 2025. The chart above suggests that the implied labor force growth based on the CBO projections has been higher than the BLS numbers over at least the past five years (orange line). Since the start of the year the CBO-implied growth number have been slowing but the echo-effect of past strong immigration will still keep it elevated compared to the BLS/Census projections.
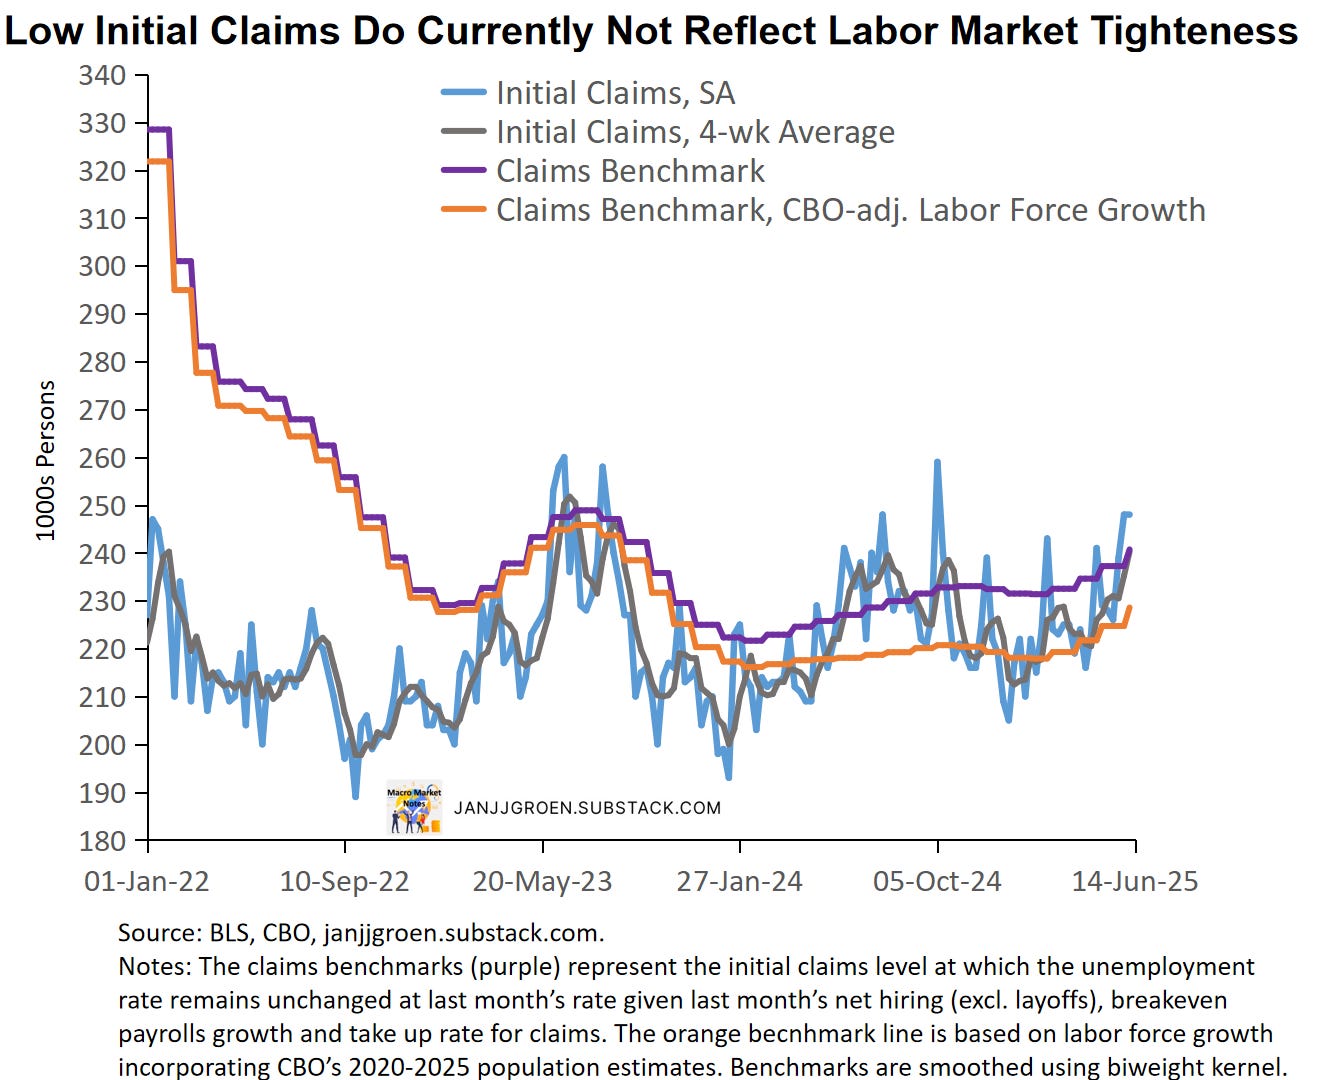
The chart above compares (seasonally adjusted) initial jobless claims and its four-week moving average with the claims benchmark rate based entirely on BLS data (purple line) as well as a claims benchmark rate that instead incorporates the CBO’s more aggressive population projections (orange line). The more aggressive population growth projections clearly have lowered the benchmark rate for claims since 2023 (orange vs purple lines in the above chart).
These benchmarks also incorporate the latest JOLTS data on hiring, quits and retirements, with the resulting net hirings remaining at historically low levels. Combined with the relatively lower breakeven jobs growth rate based on higher CBO population projections in the orange benchmark line this suggests that initial claims, and thus layoffs, have been running above replacement level in 2025 (blue & gray lines vs the orange line in the above chart).
So, given weak hiring and strong population growth rates there continues to build up upside risk with regards to the near-term outlook for the unemployment rate.