


May Payrolls: Still Steady
May payrolls growth was solid, and the unemployment rate was unchanged. Wage growth accelerated and still runs above trend.

Today’s release of the May Employment Situation report showed a solid pace of payrolls growth, and a stable unemployment rate as both the job-exit and job-finding rates increased. Hourly wage growth picked up the pace and remain above the 2% inflation pace - similar to what we have seen in previous reports. Payrolls growth trends continue to lag compared to a still elevated breakeven pace, although the latter should come down later in the year as population growth slows.
Key takeaways:
Payrolls growth was solid in May, but near-term trends continue to fall short of the breakeven pace needed to keep the unemployment rate constant at current levels based on higher population projections.
The unemployment rate remained unchanged to 4.2% as the labor force participation rate declined to 62.4%.
The job-finding rate increased over the month to 49% with smoothed trends around 47%. The unemployment rate consistent with recent job-exit and job-finding rates was broadly stable and smoothed trends suggest that in the near term the unemployment rate will likely increase to around 4.3%.
Wage growth based on composition-adjusted average hourly earnings accelerated and remain at paces inconsistent with the 2% inflation target.
The Fed is confronted with a very uncertain outlook owing to the Trump Administration’s tariff policies. Given a labor market that’s only slowing gradually, elevated inflation expectations and equally elevated and sticky underlying inflation trends, I continue to expect the Fed to remain on hold this year.
May Jobs Growth: As Expected
The May jobs report released today indicated that payrolls in the establishment survey grew more or less in line with the consensus expectation as they were up by 139,000 persons in May, compared to a 147,000 increase in the preceding month (which was revised down from 177,000 initially). Payrolls growth for March and April combined were revised down by 95,000 persons.

The unemployment rate remained unchanged at 4.2% in May. In three-digit terms the unemployment rate continued to increase over the month: from 4.187% in April to 4.244%. The three-digit unemployment rate has been drifting up since January. Household employment contracted in May by 696,000 after increasing 461,000 persons in April (chart above). Given the historical patterns in the chart above, household employment growth is likely to bounce back in future reports. Finally, the labor force participation rate decreased notably by 20bps to 62.4% after it had been increasing over the previous two months.
Underlying Labor Market Trends
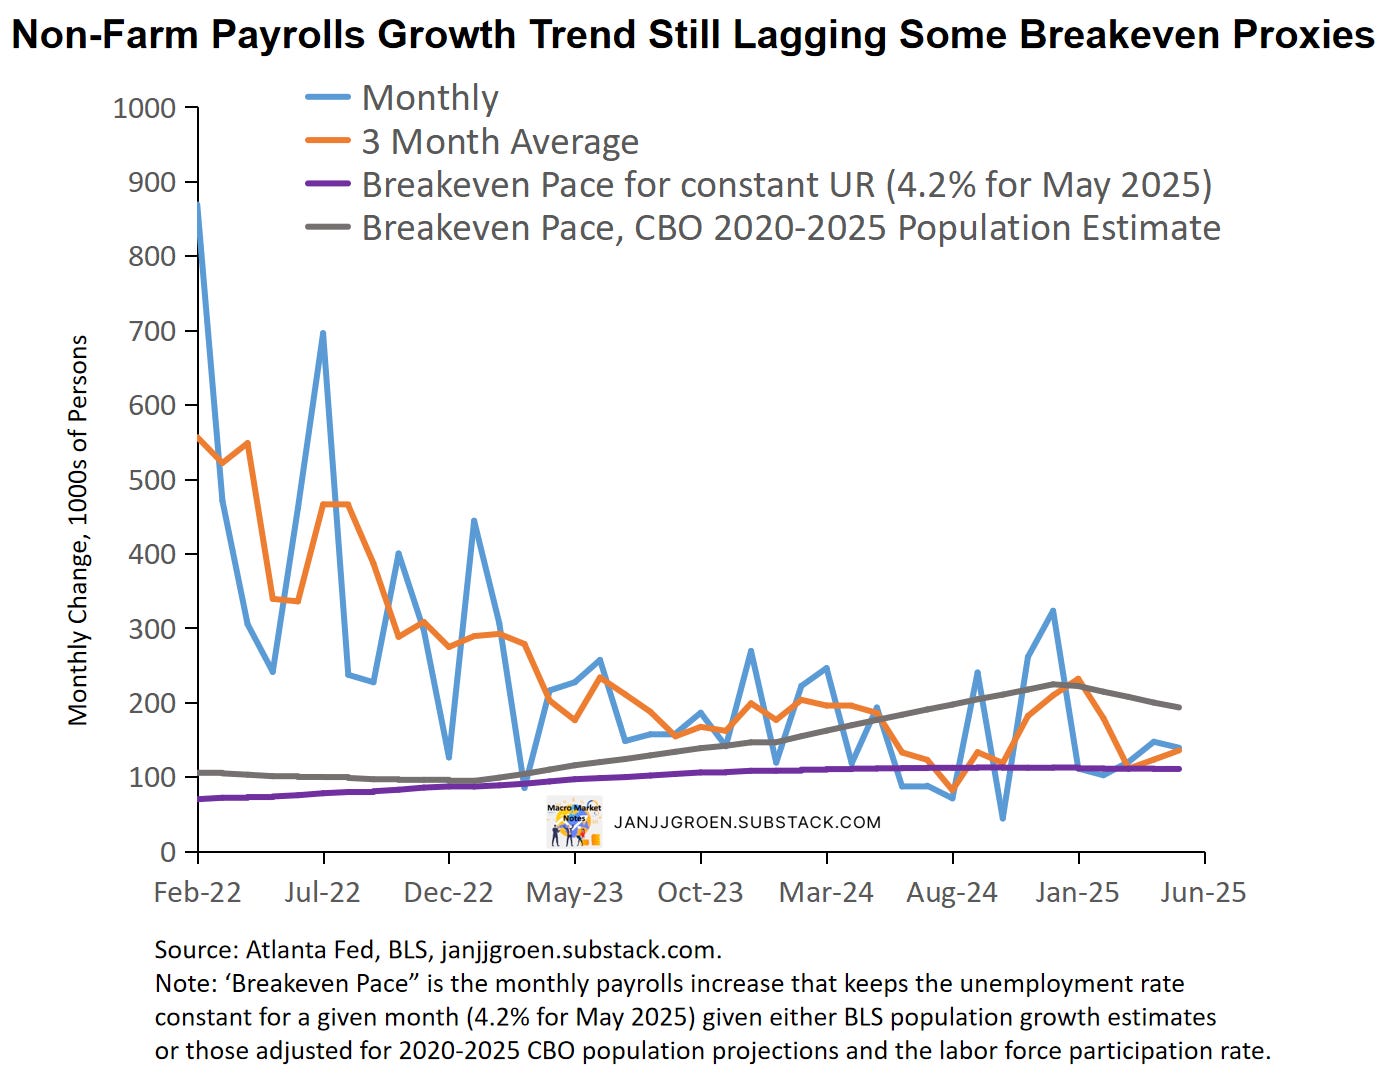
Both the monthly and three-month moving averages of payrolls changes from the establishment survey since February 2022 are shown in the chart above. The smoothed trend in payrolls growth accelerated throughout Q4 but eased in Q1 and only gradually picked up the pace again since March. It’s useful to compare this smoothed trend with the estimate of the breakeven payrolls growth pace that keeps the unemployment rate constant in a given month conditional on the BLS’ population growth estimates as well as the labor force participation rate in that month. As throughout most of 2024 this particular breakeven pace hit 111,000 persons in May (purple line in the above chart). Compared to the three-month average payrolls growth rate this would suggest that the labor market is still creating somewhat more jobs than what would be consistent with a 4.2% unemployment rate.
But, while in January the BLS adjusted its population level for upgraded net immigration projections, the pre-2025 population remained uncorrected and remains well behind pre-2025 population estimates from other institutions like the CBO. The CBO estimates that the working population grew 1.4% in both 2023 and 2024, with the pace to slow down in 2025 to 0.9%. Based on these projections I’ve included in the above chart an adjusted breakeven payrolls growth pace for a constant unemployment rate that adjusts the BLS’ population projections for 2020-2025 to bring them line with the CBO’s 2020-2025 noninstitutionalized population estimates (gray line in the chart above).
The CBO-implied breakeven pace needed to keep the unemployment rate at 4.2% is around 193,000 persons in May, down from about 200,000 in April as well as its 224,000 persons peak in December. Comparing this to the three-month average payrolls growth rate (orange vs. gray lines in the above chart) suggests that current job growth trends are still lagging this more realistic breakeven pace, with the monthly increase (139,000) also remaining below it. So, there’s likely remains upside risks to the unemployment rate over the near-term.
Additional details about the underlying strength of the labor market can be inferred from the household employment survey. Following Shimer (AER, 2005) and Shimer (RED, 2012), we can use data on total unemployed and employed persons as well as the number of people that are unemployed for less than 5 weeks to estimate:
Job-finding rate: the probability an unemployed person in month t will find a job or leaves the labor force. This is calculated assuming that total unemployment in month t+1 equals month t unemployment plus the number of people unemployed for less than 5 weeks in month t+1.1
Job-exit rate: the likelihood an employed person in month t will exit its job either due to layoffs, quits or retirement, which depends on data on the job-finding rate, unemployment and labor force.2
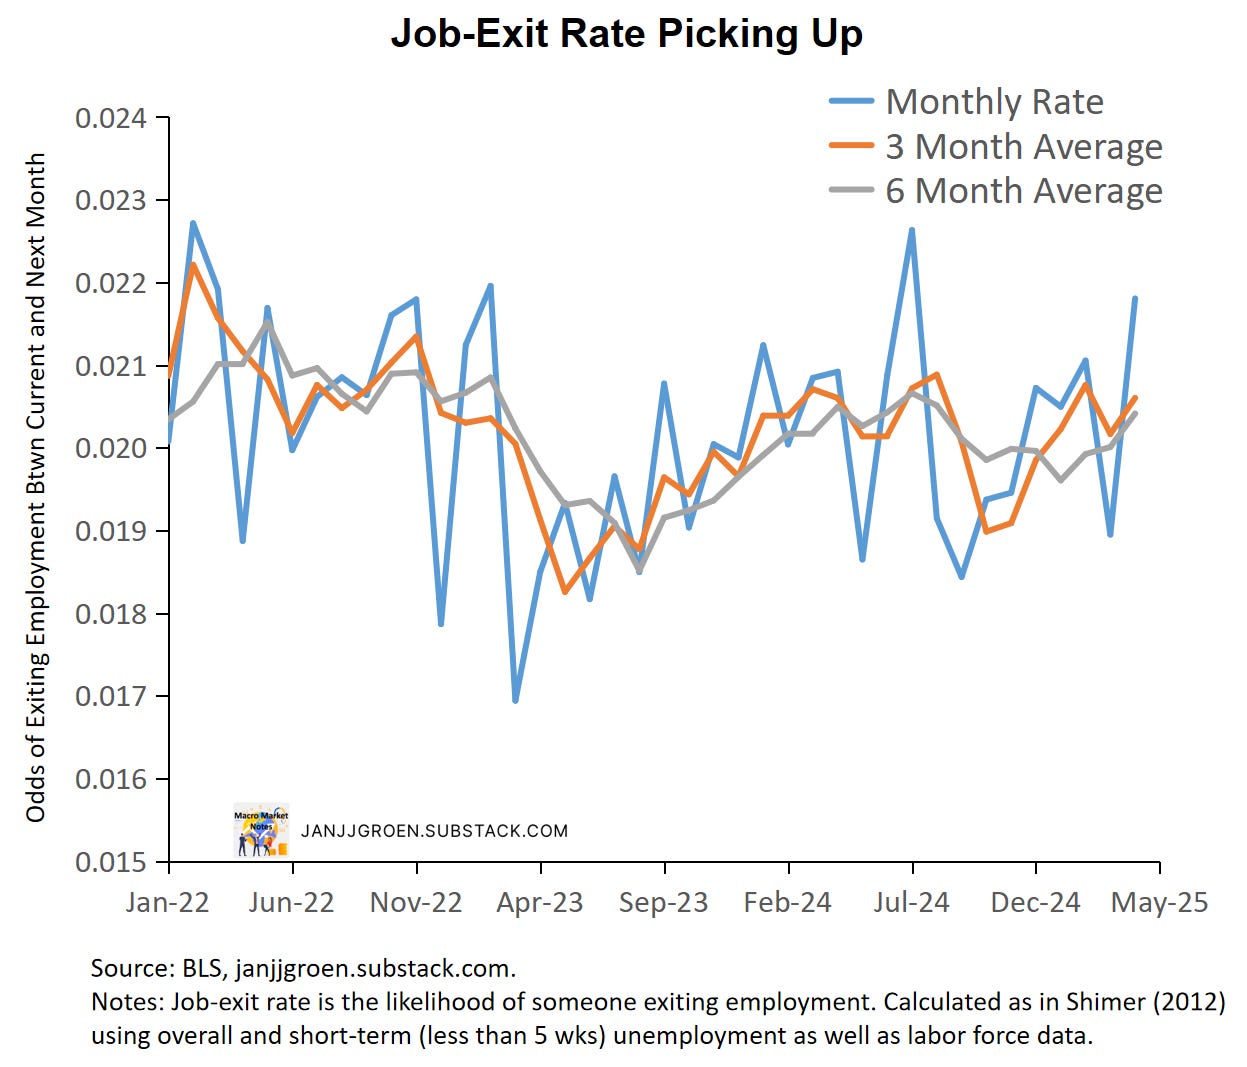
The chart above shows a plot for the estimated job-exit rate. This job-exit rate has been relatively stable over the past three years, with a moderate downward shift in the first half of 2023 that stabilized between June and October but then rose again until last summer. Note, however, that the y-axis in the chart above also makes clear that the variability in the separation rate has been really modest.
More recently, the job-exit rate eased between January and February but then increased again since April (chart above). This is in line with recent trends in jobless claims, with initial claims running above replacement levels since late Q1.
In 2023 the job-finding rate declined a lot after Q1 2023 (chart above) and this decline generally continued in 2024 to about 42% for October going into November. In 2025, the job-findings rate initially remained relatively range-bound, but dropped noticeably in March going into April. In May the overall number of unemployed persons grew less than the number of newly unemployed persons (less than 5 weeks in duration): +71,000 vs. +264,000. Given that the job-finding rate is essentially driven by the relative differential of increases in overall unemployment and newly unemployment, the likelihood to exit unemployment between April and May bounced back notably, to 49% which is about same level where it was in March (chart above). Three- and six-month averaged job-finding rates for April into May also picked up to around 47%.
As in Shimer (AER, 2005) we can combine the above discussed job-exit and job-finding rates to calculate a flow-consistent unemployment rate and the chart above plots both the corresponding monthly rate and the three-month average of this rate. The (three-month average) flow-consistent unemployment rate is the unemployment rate that prevails when the job-exit and job-finding rates remain constant at their current (three-month average) levels. Deviations compared to the official unemployment rate should dissipate over time and frequently predict future changes in the official rate.

The in terms of flows labor market showed a lot of turnover in May with both the job-exit rate (layoffs) and the job-finding rate (hiring) picking up — the chart above shows that this led to a broadly stable monthly flow-consistent unemployment rate for April into May at 4.3%. Given the choppiness in this measure, it’s probably more useful to look at three-month averages.
The three-month averages of headline and flow-consistent unemployment rates had been broadly similar between September and February (solid blue and orange lines in the chart above) suggesting stabilization of the unemployment rate around 4.2%. Since March, however, the three-month averaged flow-consistent unemployment rate has been overshooting its headline counterpart by about 10bps, which would suggest a persistent shift up in the unemployment rate to around 4.3% is forthcoming.
Both smoothed payrolls growth trends and the job flows data show signs that the labor market is gradually slowing, with the unemployment rate likely to drift up to around 4.3% over the near-term.
Wage Growth Pace Picked Up Again
Average hourly earnings of all private sector employees grew 0.4% month/month in May, up from (an unrevised) 0.2% in April, and in year/year terms it also up from (an upwardly revised) 3.8% in April to 3.9%. For production and non-supervisory workers, hourly earnings growth accelerated for the second consecutive month, to 0.4% month/month in May from (an unrevised) 0.3% in the preceding month and on a year/year basis it picked up slightly to 4.1% from (an unrevised) 4% in April.
The wage data from the jobs report are notoriously noisy, given that they are revised often and do not correct for the sectoral and skills composition of jobs growth over the month. There are better quality wage data available, such as the Atlanta Fed Wage Growth Tracker and the Employment Cost Index, but the Atlanta Fed does construct a rudimentary composition correction for average hourly earnings from the jobs report, which can be found here.
When applying the Atlanta Fed composition correction on the monthly average hourly earnings for May, the correction kept the growth rate for all private workers unchanged at 0.4% but lowered it for April to 0%. Similarly for production & non-supervisory workers, this correction essentially left the official 0.4% pace for May unaffected but lowered the April pace to 0.1%.

From the chart above one can observe that the three-month wage growth rate has eased to about a 3.6% annualized pace in May after it also slowed in April. However, the six- and 12-month wage growth rates have converged back to 4%, which has been their trends over the past year to year-and-half.
I can combine labor productivity and labor share trend estimates with the 2% inflation target, along the lines I have done in my “Wages and Inflation Expectations” notes and incorporating the 2024 Q4 update of productivity data to get a medium-run annual wage growth rate consistent with 2% inflation.
Additionally, instead of the 2% target one can use my “Main Street” year-ahead inflation expectations proxy, i.e., the common trend across survey-based near-term inflation expectations from firm and consumer surveys. After incorporating May data for the Conference Board, University of Michigan and Atlanta Fed surveys this estimate suggests "Main Street" inflation expectations rose from 2.4% y/y PCE in Q4 to 3.3% in March and continued Upward to 3.6% in April data and a jump to 4.3% in May. This reinforces that firms and households remain uneasy about near-term inflation amidst persistent policy uncertainty.

Compared to both the composition-adjusted AHE data for production and non-supervisory workers for February and the unsmoothed Atlanta Fed wage tracker into January, annual wage growth rates still outpace the 2.83% pace consistent with 2% PCE inflation in the medium term (green line in the above chart).
Current wage growth, however, does fall short of the wage growth pace consistent with 4.3% PCE inflation implied by “Main Street” near-term inflation expectations for May (blue line in the chart above). Smoothed over three months, both the composition-adjusted AHE data for production and non-supervisory workers and the Atlanta wage tracker run around 4.3% year/year, which given a three-month average of the 2%-inflation pace of 2.8% year/year suggests that wage trends are broadly consistent with 3% PCE inflation.
After the conclusion of the May FOMC meeting the Fed clearly signaled that given an economy that still is in a fairly good shape, the Fed can be patient and assess how the administration’s policies will adversely impact the Fed’s dual mandate. Rapidly rising inflation expectations seem to validate such a cautious approach to further rate cuts. Today’s May jobs report showed that while the labor market is slowing, it’s slowing at a gradual pace. Furthermore, wage growth continues to run at rates well above the pace consistent with 2% inflation over the medium-term, and probably more in line with 3% inflation. So, given today’s report, elevated “Main Street” inflation expectations, and equally elevated and sticky underlying inflation trends I continue to expect the Fed to remain on hold this year.
Given this calculation, the job-finding rate will run up to April utilizing data on (short-term) unemployment for May.
As the calculation of the job-separation rate depends also on (short-term) unemployment for May, we cannot go beyond April.