June Payrolls: A Turning Point?
June payrolls growth was strong, but job-finding rates declined notably resulting in rising unemployment. Wage growth remains elevated.
Today’s release of the June Employment Situation report was rather confusing. Payrolls growth picking up, unemployment rose as the job finding rate dropped significantly, and wage growth remains elevated. The Fed will take note as we might be approaching a turning point in the labor market.
Key takeaways:
Payrolls growth momentum remains strong, and trends continue to run above the breakeven pace needed to keep the unemployment rate constant.
The unemployment rate hit 4.1% as the labor force participation rate increased from 62.5% to 62.6%.
The job-finding rate fell over the month to 42% with smoothed trends also declining below 50%. The unemployment rate consistent with recent job-separation and job-finding rates suggest a negative near-term outlook for the official unemployment rate.
Wage growth remains elevated, with momentum in composition-adjusted average hourly earnings turning away from the pace consistent with 2% inflation and supported by a pickup in “Main Street” inflation expectations in Q2.
Today’s data will make the Fed more aware of the potential of a larger-than-expected slowing in economic activity when assessing the inflation data to determine the start date of rate cuts.
June Jobs Growth: Still Strong
The June jobs report released today indicated that payrolls in the establishment survey surprised to the upside as they were up by 206,000 persons in June, compared to a 218,000 increase in the preceding month (which was revised down from 272,000 initially). Payrolls growth for April and May combined were revised down by a notable 111,000 persons.
The unemployment rate increased 0.1 percentage point to 4.1% in June. In three-digit terms the unemployment rate went up from 3.964% in May to 4.054%. Household employment grew again in June: from -408,000 persons in May to +116,000 persons. Meanwhile, the labor force grew by 277,000 persons, outpacing a population growth of 190,000 persons in June and this resulted in a higher labor force participation rate at 62.6% relative to 62.5% in May. While the unemployment rate increase in May was mostly due to the number of persons leaving the labor force, in June people actually came back into the labor force (by 87,000) so labor supply dynamics played less of a role in this report.
The chart above compares the job growth signals from the establishment and household surveys, and it shows the excess volatility of the household survey relative to the establishment survey, with the former mean-reverting back to the latter relatively soon after big household survey moves in either direction. As expected, in June employment growth from the household survey again showed signs of catching up with the establishment survey.
Moving beyond the month-to-month movements, the chart above shows three- and six-month moving averages of payrolls changes from the establishment survey since January 2022. The underlying pace of job creation in the U.S. economy slowed through October 2023 but since then the pace of payrolls growth picked up again. With smoothed trends in payrolls growth remaining above 200,000 persons, payrolls growth remains well above the breakeven pace needed to keep the unemployment rate at 4.1% over the next 6 months (purple dashed line in the above chart).
Additional details about the underlying strength of the labor market can be inferred from the household employment survey. Following Shimer (AER, 2005), we can use data on total unemployed and employed persons as well as the number of people that are unemployed for less than 5 weeks to estimate:
Job-finding rate: the probability an unemployed person in month t will find a job or leaves the labor force. This is calculated assuming that total unemployment in month t+1 equals month t unemployment plus the number of people unemployed for less than 5 weeks in month t+1.1
Job-separation rate: the probability an employed person in month t will either loses its job, quits or retires, which depends on data on the job-finding rate, unemployment and employment.2
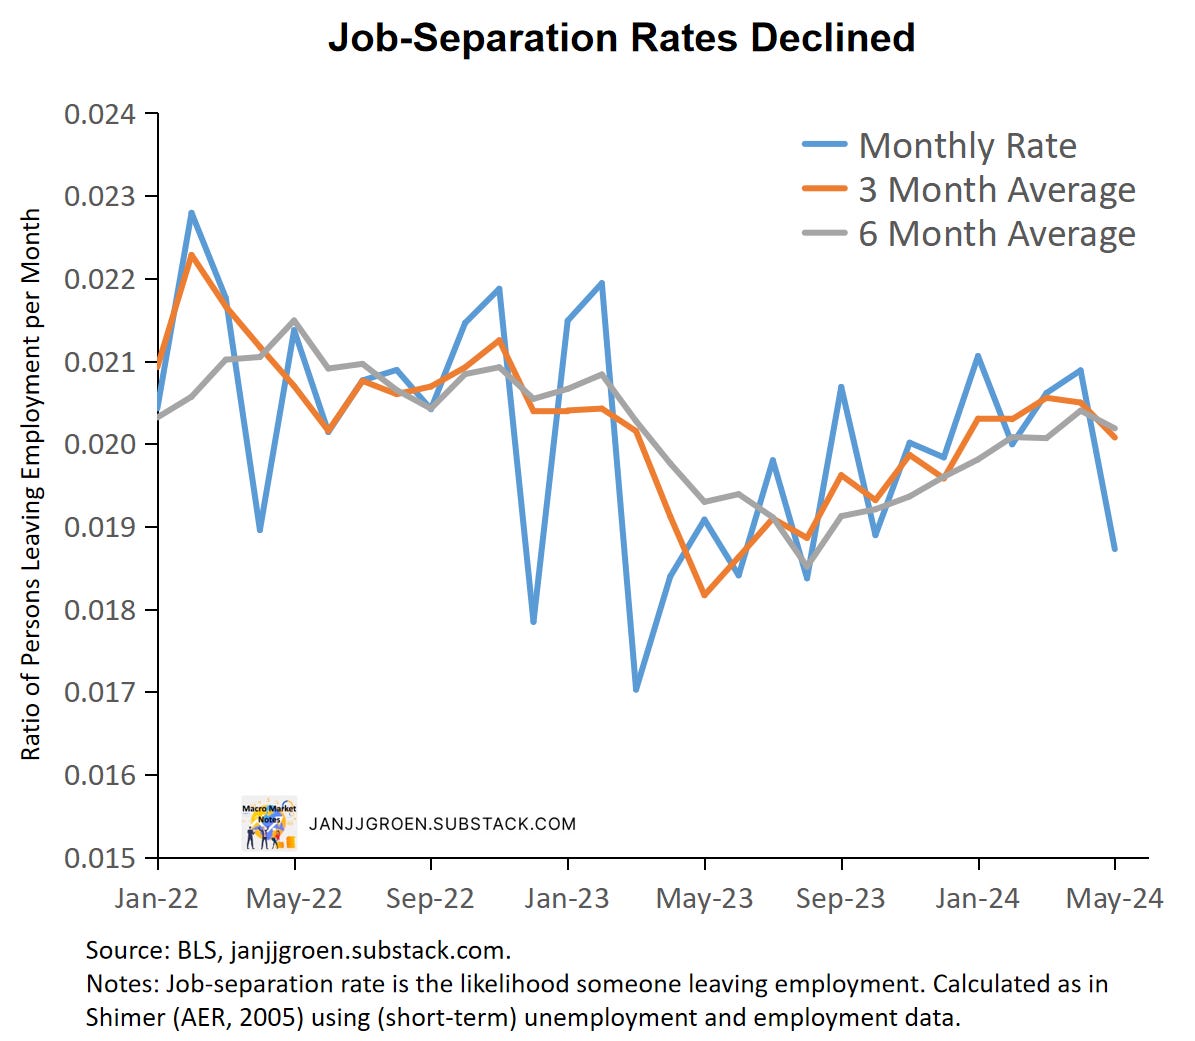
The chart above shows a plot for the estimated job-separation rate. This job-separation rate has been relatively stable over the past two year, with a moderate downward shift in the first half of 2023 that stabilized between June and October, but then rose again until recently, as layoffs and retirements picked up. Note, however, that the chart above also makes clear that the variability in the separation rate has been really modest.
Job separations declined between May and June (chart above), coinciding with a pickup in the labor force participation rate. Job separation rates remain below those seen in 2022.
In 2023 the job-finding rate declined a lot after Q1 2023 (chart above) but recovered since the summer, rising to about 54% on the month and 52% on a three-month average basis in December.
However, in 2024 the job finding rate declined again and deteriorated notably for people who were unemployed in May going into June. In June the total unemployed number of persons grew whereas the number of newly unemployed persons (less than 5 weeks in duration) declined: +162,000 vs. -181,000. This suggests that it became a lot harder to exit unemployment between May and June, resulting in a notable drop in the job-finding rate to about 42% for May from 48% previously (chart above). Three- and six-month averaged job-finding rates for May also declined to around 48%.
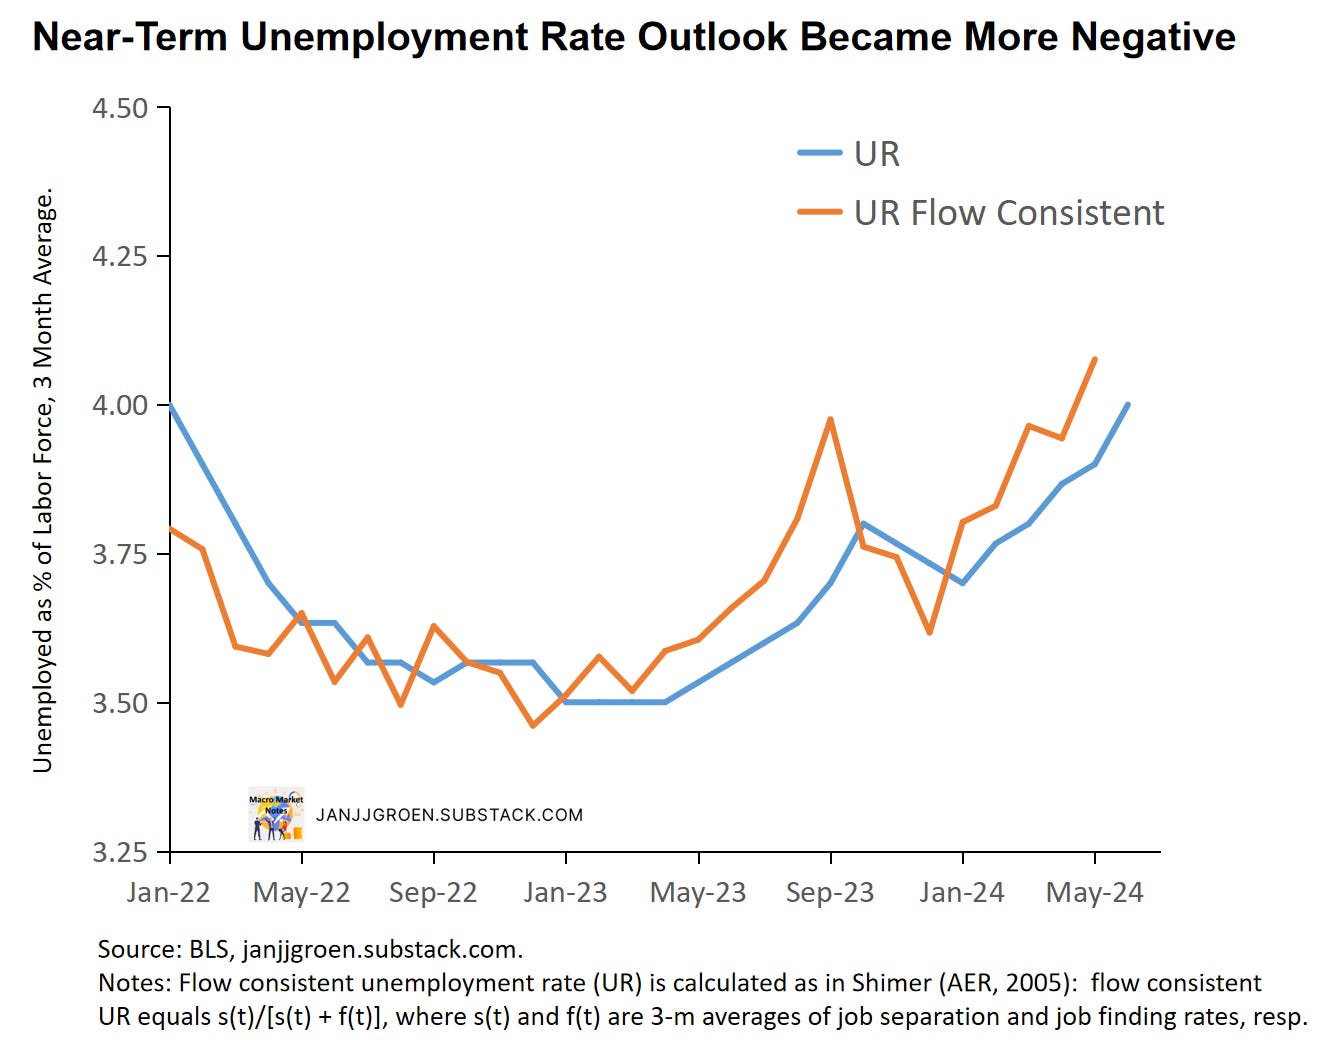
As in Shimer (AER, 2005) we can combine the above discussed job separation and job finding rates to calculate a flow-consistent unemployment rate and the chart above plots the three-month average of this rate. The three-month average flow-consistent unemployment rate is the unemployment rate that prevails when the job separation and job finding rates remain constant at their current three-month average levels. Deviations compared to the official unemployment rate should dissipate over time, and often leads changes in the official rate.
Since January the flow-consistent unemployment rate has been outpacing the official unemployment rate and leading the rise in the latter (chart above). It is largely driven by a deterioration in the job finding rate over that period with job separations being more stable, and it suggests labor demand has weakened such that the labor market no longer has the capacity to absorb the longer term unemployed. This is the mirror image of what happened in 2022 and suggests the potential of further unemployment rate increases in the near term.
Wage Growth Remains Elevated
Average hourly earnings of all private sector employees grew over the month in June by 0.3% month/month from 0.4% in May and increased substantially in year/year terms from 4% in May to 4.7%. For production and non-supervisory workers, hourly earnings were up 0.3% month/month in June from (a downwardly revised) 0.4% in the previous month, and on a year/year basis they increased from 4% (downwardly revised) to 4.4% in June.
The wage data from the jobs report are notoriously noisy, given that they are revised often and do not correct for the sectoral and skills composition of jobs growth over the month. There are better quality wage data available, such as the Atlanta Fed Wage Growth Tracker and the Employment Cost Index, but the Atlanta Fed does construct a rudimentary composition correction for average hourly earnings from the jobs report, which can be found here.
We can observe from the chart above chart that the easing in wage growth in April was also an outlier using this composition correction. Since then, corrected wage growth rates firmed back up towards 4%.
I can combine labor productivity and labor share trend estimates with the 2% inflation target, along the lines I have done in my “Wages and Inflation Expectations” notes and incorporating the Q1 update of productivity data to get a medium-run annual wage growth rate consistent with 2% inflation. Additionally, instead of the 2% target one can use my “Main Street” year-ahead inflation expectations proxy, which after incorporating June inflation survey data suggests that near-term inflation expectations picked up in Q2 compared to Q1 (chart above).
Compared to the composition-adjusted AHE data for production and non-supervisory workers, annual wage growth still outpaces the 2.5% pace consistent with 2% PCE inflation in the medium term (green line in the above chart). In fact, sticky “Main Street” near-term inflation expectations seem to put a floor under wage growth well above this target-consistent pace (blue line in the chart above). The Fed will be not pleased with this lack of actual wage growth easing towards the inflation target-consistent pace of wage growth. The elevated real wage costs implied by the chart above likely also drove the drop in labor demand I discussed earlier.
September Rate Cut?
Fed officials came out of their June FOMC meeting emphasizing caution when it comes to inflation even as the May PCE data could be seen a first sign that disinflation might be returning. With some Fed officials referring to 'quarters' of inflation progress it is most likely the case that the Fed is not prepared to cut policy rates until underlying PCE inflation hits 2.5% or less at an annualized six-month basis.
If we continue to see weak monthly inflation this summer this could mean a rate cut is possible at the September FOMC meeting. Especially if there is growing evidence of an economic slowdown this year more severe than what the Fed projected in its June SEP projections. Today’s jobs report could be a first signal of that happening.
The next two jobs reports ahead of the September meeting will be crucial: the drop in the job finding rate was quite outsized in today’s report whereas the separation rate actually eased. Usually when entering a recession, the job separation rate increases a lot ahead of the job finding rate. So, we need to see further evidence whether this job finding decline persists. Continued elevated wage costs, on the other hand, still provide an upside risk to services inflation, so the Fed will be very careful not to engage in policy rate easing too soon.
Given this calculation, the job-finding rate will run up to May utilizing data on (short-term) unemployment for June.
As the calculation of the job-separation rate depends also on (short-term) unemployment for May, we cannot go beyond April.


