


Feb CPI, Initial March Sentiment and Jobless Claims Trends
February core inflation eased but trimmed means remain firm. Consumer sentiment turned stagflationary. Jobless claims continued to point to stable unemployment.

This post reviews trends from the most notable data releases this week: the February CPI and the preliminary University of Michigan consumer survey. In addition, I look at recent trends in jobless claims.
Key takeaways:
Core CPI inflation eased in February, but trimmed mean CPI measures were firmer and suggest that in terms of underlying PCE inflation trends likely will be picking in the near-term.
Preliminary March household sentiment data from the University of Michigan suggests households are increasingly adhering to a stagflationary outlook with inflation expectation rising in conjunction with a more downbeat unemployment outlook. Combining several firms’ and household inflation expectation measure indicates a common expected inflation trend that has been drifting up since October, with recent elevated policy uncertainty exacerbating this acceleration.
Initial jobless claims into March remain at relatively low levels. Despite these low levels, historically low net hiring and strong population growth recently meant that relatively low initial claims do not signify a tight labor market.
The recent data suggest the Fed will remain on hold for a while given the underlying inflation trend.
February CPI: Easier but Still Firm
The topline numbers of the February CPI report were somewhat below consensus expectations. Headline CPI increased 0.2% (forecast: 0.3%) over the month in February after rising 0.5% in January, whereas core CPI inflation was +0.2% month/month (three-digits: +0.227 compared to +0.446 in January) while the forecast was for +0.3%.
To get a feel of real underlying CPI inflation, one can look at the Cleveland Fed's trimmed mean CPI measures, which cast away excess volatile elements by either taking the median (price change of the CPI component at the 50th percentile across all price changes) or a 16% trimmed mean (weighted average of price changes once both the top 8th percentile and lowest 8th percentile of price changes are deleted). The Median CPI inflation measure eased only slightly from +0.32% month/month to +0.29% in February, whereas the 16% Trimmed Mean CPI inflation rate decelerated to +0.27% month/month in February from +0.41% in the preceding month. For both trimmed mean inflation measures (a.k.a. underlying inflation) the February increases were in line with their average monthly paces in Q4, whereas for core CPI inflation it was below. So, trimmed mean CPI inflation measures remain stickier relative to core CPI inflation.

Heightened tariff uncertainty is often assumed to encourage firms to front-load investment spending. Similarly, consumers might well have been accelerating durable goods purchases (e.g., cars, appliances) in anticipation of higher future costs (I noted this in the context of the December PCE report). Furthermore, with a lot of potential tariff hikes also potentially impacting non-durable goods, the chart above suggests that such a shift has reversed core goods CPI’s decline since mid-2023, coinciding with increased trade policy uncertainty since the election.
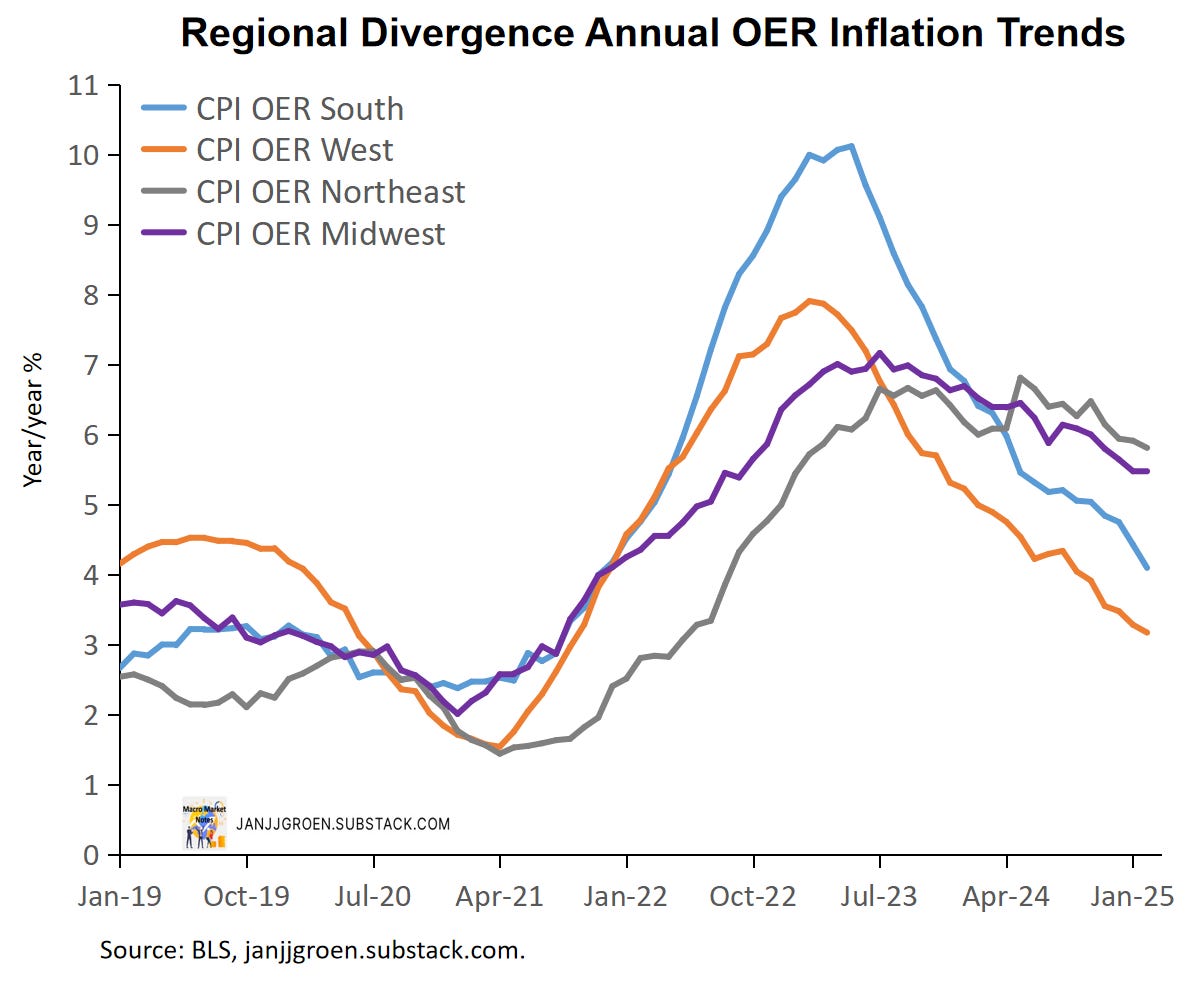
As usual a big driver behind CPI inflation dynamics was its CPI Rent of Shelter component (OER+Rent), and this item indeed eased over the month from +0.5% month/month in January to +0.4%. The South and West Census regions have been dealing with an oversupply of rental properties over the past year, but rental demand and supply have been more balanced in the Northeast and Midwest. For the latter the year/year OER rates consequently remained fairly stable above pre-COVID levels in contrast to the South and West (chart above). This divergence thus might well result in a more muted overall OER disinflation, so it remains to be seen if OER inflation will return to a pre-COVID pace. Disinflation needs to be more broad-based and the trimmed mean CPI inflation metrics suggests that this, for now, may not be the case.

The Median CPI and 16% Trimmed Mean CPI inflation rates are overshooting the Fed's 2% inflation target over a 6-month period (at 3% and 3.3% in core PCE terms, resp.) -- see the chart. Using the correlations between the CPI and PCE trimmed mean inflation series, statistical nowcasts of Trimmed Mean PCE inflation rates (due later this month) suggest near-term underlying PCE inflation trend measures increased further in February to the 2.6%-2.9% range in core PCE terms (diamonds in the above chart).
The nowcasts of underlying PCE inflation dynamics make clear that the near-term trend is still firming. Given the messages from the underlying trends in this CPI report and a solid February jobs report, expect the Fed to remain on hold to at least the May FOMC meeting and await the impact of forthcoming tariff hikes.
Preliminary March Consumer Survey and "Main Street" Inflation Expectations
The preliminary University of Michigan Consumer Sentiment survey for March showed household sentiment sliding for the third consecutive month, with expectations for personal finances, labor markets, inflation, business conditions, and stock markets declining but current conditions remaining broadly stable. Respondents cited policy uncertainty impacting plans for the future, regardless of political views.

Many noted the sharp rise in one-year expected unemployment in the preliminary March survey (orange line in the above chart). Such moves rarely occur outside recessions, so some dismissed the inflation expectations rise as a fluke, suggesting disinflation is more likely. However, there are precedents. As the chart above shows, before the 1980 recession, both year-ahead inflation expectations and expected unemployment rose well into that downturn, with realized inflation and unemployment also rising going into it. The trend in household sentiment over recent months could thus indicate a stagflationary shift, as in 1978-1980, rather than a disinflationary path.
Inflation expectations saw another big move in this survey. Other consumer surveys have also risen. Some on Wall Street doubt these surveys' usefulness, arguing consumers have no clue or selectively choosing surveys that fit their narratives. I disagree. Firms, households, and traders have a stake in getting expectations right—unlike forecasters. Academic research, including mine, has shown these expectations help forecast inflation. They’re not perfect, but rather than "picking and choosing," we should aggregate them.
One-year ahead inflation expectations in the preliminary University of Michigan survey jumped again in March, from 4.3% to 4.9%, marking the third straight 50bps+ monthly rise. While this may be survey-specific, other measures have also increased. The Conference Board consumer survey saw an 80bps rise in February, while the Atlanta Fed Business Inflation Expectations and NY Fed consumer surveys also ticked up in February (chart above).
The above chart shows the common trend I extract from business and household inflation expectations, using a methodology outlined here, incorporating February and March data. This common trend suggests "Main Street" inflation expectations have been rising since October, continuing into Q1. The increase is notable relative to Q4, though less dramatic than the University of Michigan measure. More data is still coming in for March, but for now, the common trend points to a year-ahead expectation of 3.1% in year/year PCE inflation terms—the highest since October 2023.
Different indicators of inflation expectations within firms and households have been pointing to elevated near-term inflation since fall, with policy uncertainty exacerbating the upward drift.
This Week’s Initial Jobless Claims Trends
Initial claims for the week ending March 8th decreased slightly by 2000 persons compared to the preceding week and stood at 220,000 persons.
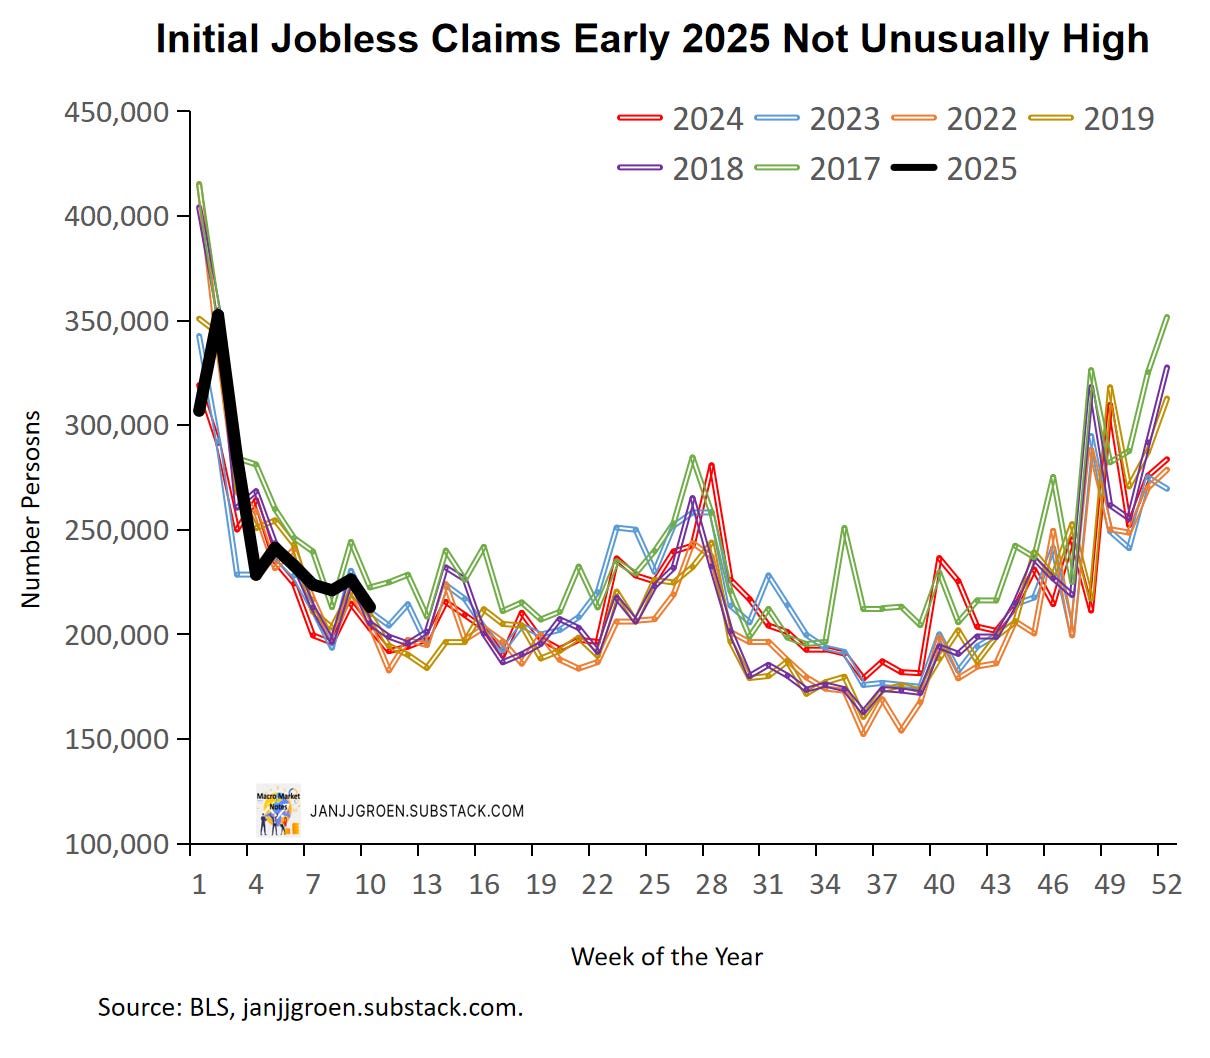
When I focus on non-seasonally adjusted data and compare the data for the week ending March 8 with data from previous years in the same week it suggests initial claims recently have in line with the typical dynamic of this time of the year (chart above).
In terms of the unemployment outlook, initial claims are usually considered as a high frequency, real-time indicator of layoffs. What is relevant in that context is whether the layoff rate as implied by initial claims is significantly high or low to put substantial upward or downward pressure on the unemployment rate. To assess this, I laid out earlier a methodology to determine a benchmark rate for initial claims for the current month that equals the maximum number of initial claimants that will keep the unemployment rate constant relative to the previous month. If current initial claims rise above this claims benchmark rate, initial claims could potentially start to add to the unemployment rate.

The chart above compares (seasonally adjusted) initial jobless claims and its four-week moving average with the claims benchmark rate based entirely on BLS data (purple line) as well as a claims benchmark rate that instead incorporates the CBO’s more aggressive population projections for 2020-2024 (orange line). This CBO population projection reflects the 2025 update published on January 13, which incorporates stronger net immigration estimates than the Census estimates used by the BLS, at least until the current year. The more aggressive population growth projections clearly have lowered the benchmark rate for claims in 2023 and 2024 (orange vs purple lines in the above chart).
These benchmarks also incorporate the latest JOLTS data on hiring, quits and retirements, with the resulting net hirings dropping to historically low levels. Combined with the relatively high breakeven jobs growth rate based higher CBO population projections in the purple benchmark line this suggests that layoffs really need to remain very low for the labor market not to deteriorate meaningfully. So, although initial claims have been low this does not signify a tight labor market given weak hiring and strong population growth rates, as they are currently running slightly higher than the rate that would keep unemployment stable at 4.1% (blue & gray lines vs the orange line).
Underlying trends in the February CPI report suggest firmer inflation might still be in the pipeline, while households seem to adhere more and more to a stagflationary outlook with expected inflation rising in conjunction with expectations of rising future unemployment. Nonetheless, going into March the labor market remains stable. The Fed will remain cautious about further cuts (if any) in 2025, especially given the uncertainty about tariffs.