


April CPI & Retail Sales
April core inflation rose less than thought; trimmed mean measures remained firmer. Real retail sales for goods fell in April but grew for bar/restaurant sales.

This post reviews trends from the most notable data releases this past week: the April CPI and retail sales reports.
Key takeaways:
Core CPI inflation accelerated less than expected in April but trimmed mean CPI measures nonetheless continue to suggest that in terms of underlying PCE inflation, trends remain sticky above the Fed’s inflation target.
Inflation-adjusted retail sales contracted over the month for both core goods and core goods excl. motor vehicles in April but grew at a solid pace for bar/restaurant spending.
The recent data suggest the Fed will remain on hold for a while given the underlying inflation trend as well as the expected inflationary impact of import tariff hikes.
April CPI: Calm Before …
The topline numbers of the April CPI report were below consensus expectations: headline CPI rose 0.2% (forecast: +0.3%) in April after declining 0.1% in March, while core CPI inflation was +0.2% m/m (three-digits: +0.237 vs. +0.057 in March) and the forecast was for +0.3%.
To assess underlying CPI inflation, a look at the Cleveland Fed's trimmed mean CPI measures is useful, as these strip out volatile elements using either the median (price change at the 50th percentile) or a 16% trimmed mean (weighted average excluding the top and bottom 8% of price changes). As was the case last month, these trimmed mean CPI measures provide a more nuanced picture than the topline numbers: The Median CPI inflation rate remained steady at +0.33% m/m vs. +0.34% in March. The 16% Trimmed Mean CPI rose to +0.25% in April from +0.21%. In Q1, both trimmed mean inflation measures averaged around +0.3% monthly—similar to Q4 2024—while monthly core CPI averaged +0.2%. Trimmed mean inflation remains stickier than what core CPI implies.

A key driver remains Rent and OER: CPI Rent of Shelter inflation accelerated to +0.4% month/month from +0.2% in March. Year/year OER rates remain stable above pre-COVID levels in the Midwest, Northeast, and South, and while in the West they are below pre-COVID levels there’s some tentative signs of a pickup in year/year OER rates in that region (chart above). It thus remains to be seen if a nationwide return to pre-COVID trends is in store this year. Also note that while housing services drive ~40% of core CPI, they account for under 20% of core PCE—the Fed’s preferred price gauge. So, disinflation must be broader based, and the trimmed mean metrics suggest that this may not be the case.

The buildup to the early April "Liberation Day" tariff hike announcements spurred a burst in consumer spending on big-ticket items (e.g., cars) earlier in the year and expanding Q1 inventories. This led to a surge in goods imports in Q1. So, the tariff hikes resulting in sharply higher goods inflation in April was unlikely while firms are working through their inventories. Instead, amid ongoing trade policy uncertainty, expect firms to implement rolling price hikes over the remainder of the year. Still, some import-heavy CPI categories already posted notable price gains in April (chart above).
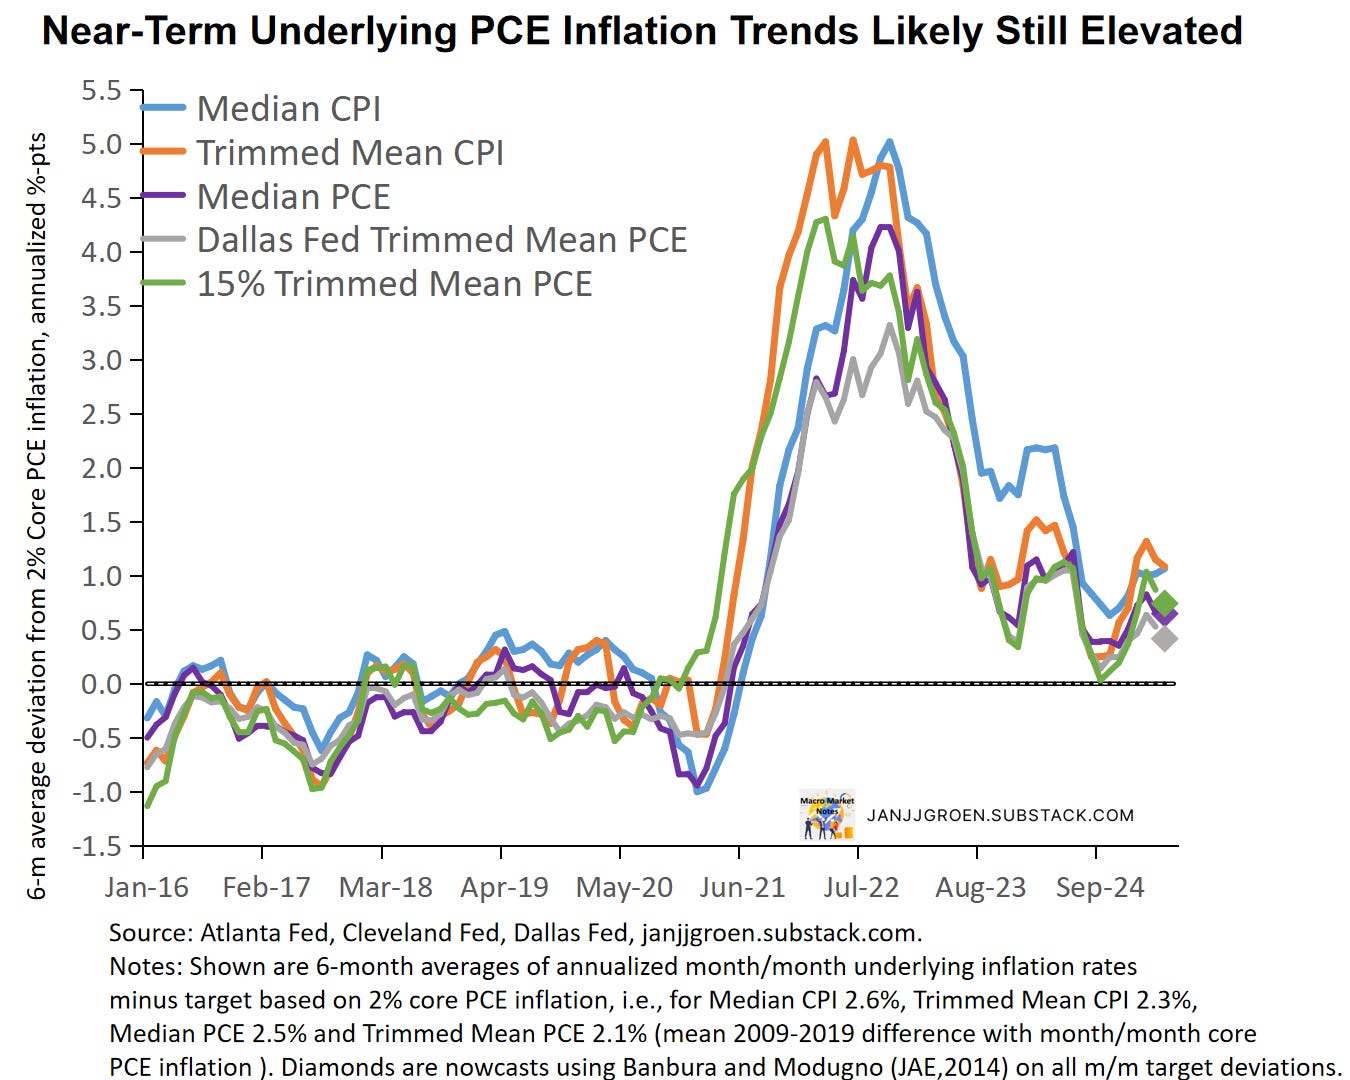
Both the Median and 16% Trimmed Mean CPI inflation rates are running above the Fed's 2% target on a six-month basis (around 3.1% for both in core PCE terms), with six-month averages easing only slightly (chart above).
When using the strong correlation between the CPI and PCE trimmed mean inflation series, statistical nowcasts of Median and Trimmed Mean PCE inflation rates for April (due later this month) imply that near-term underlying PCE inflation trends likely stayed elevated within the 2.4%-2.7% range (diamonds in the above chart).
These nowcasts show that the inflation trend remains above the Fed’s 2% goal. With core inflation likely to rise further due to tariffs, expect the Fed to stay on hold—likely for the year.
April Retail Sales: Downbeat Goods Spending
Retail trade (i.e. retail sales pertaining to goods) fell 0.1% over the month in April, after increasing 1.5% month/month in March. It's crucial to remember to not take these figures at face value without looking under the hood:
Retail sales measures spending on goods as well as bar/restaurants spending. Thus, it really mostly measures goods consumption which is a relatively small slice of the monthly consumption basket, as about 2/3 of U.S. consumption expenditures relates to services.
Retail sales data does not correct for changes in prices, which for goods in particular can make a big impact: core goods prices in the April CPI report increased 0.2% month/month. As such retail sales growth, for example, could merely reflect more the pace of price increases rather than changes in retail sales volumes.
Deflating retail sales with CPI or core CPI overlooks the predominantly goods-focused nature of retail spending.
Dissecting retail trade data into subcomponents and aligning them with corresponding CPI subcomponents provides a more accurate assessment. Firstly, when it comes to retail trade data (that is, retail sales minus nominal bar and restaurant spending) I use the CPI Commodities, CPI Gasoline, CPI New & Used Vehicles and CPI Motor Vehicle Parts & Equipment indices to inflation adjust over retail trade as well as components related to sales at gasoline stations and motor vehicle dealers & parts. In case of bar and restaurant spending I deflate that component by means of the CPI Food Away from Home index.
Furthermore, I apply chain-weighting based on the Fisher index approach using current period and previous period prices and quantities of retail trade and the gas and motor vehicle components to parse out the impact of the latter two volatile components. This approach allows for time-varying weights, as prices and quantities change from period to period and consumers substitute between the different spending categories. It is the same methodology used by the BEA to compute real consumption and GDP.

Real core goods spending (inflation-adjusted retail sales excl. gas stations) went up 6.8% on a 3-month annualized rate (AR) basis in April, after declining in February and March, as is evident from the chart above. Real core goods sales excluding motor vehicles, however, fell 3.1% three-month AR pace, after increasing 1% in March (orange line in the chart above). Finally, inflation-adjusted bar and restaurant spending grew substantially at 10.6% 3-month AR in inflation-adjusted terms in April, after an equally strong 7.3% increase in March (purple line in the chart above).

The chart above indicates that while the three-month growth pace of inflation-adjusted core goods spending accelerated in April, on a monthly basis real goods sales excl. gas stations decreased 0.9% AR in April after increasing 22.9% in the preceding month (blue line). Real core goods spending excl. motor vehicles declined 1.4% month/month AR in April, which was a substantially less severe decline compared to March’s -19.9% (orange line).
In contrast to the more downbeat data on goods consumption, inflation-adjusted bar and restaurant spending grew again at a solid pace in April albeit slower than in March (purple line in the above chart): +9.3% month/month AR in April vs +37.1% previously. These are the highest inflation-adjusted month/month growth rates for this spending category since September and remains somewhat at odds with really downbeat readings from a range of consumer sentiment surveys since Q4.
Going into Q2 the relevant metrics for consumption expenditures in GDP are real core goods excl. motor vehicle dealer and maintenance spending as well as real bar/restaurant spending. While these metrics imply that consumption of goods started off on a downbeat note in Q2, still relatively upbeat bar/restaurant spending suggest a more positive Q2 outlook for services consumption.
While the near-term outlook for household spending is somewhat of a mixed bag, with the inflation trend stubbornly above the Fed’s 2% goal and core inflation likely to pick up owing to tariff hikes, the Fed is bound to stay on hold in terms of its policy rate.