


Q1 2025 Productivity & Wages: No More Boost
Labor productivity growth eased below trend, with the opposite happening for the labor share. The latter had been the main driver of wage growth in 2024.

Today's release of the BLS's preliminary "Productivity and Costs" report for Q1 showed a notable slowdown in the quarter/quarter labor productivity growth for the second consecutive quarter. Growth of the labor share, on the other hand, again accelerated substantially on a quarterly basis like it did in Q4. Medium-term trends in these series can be used to interpret recent wage growth, such as, for example, for the Fed’s favorite wage growth gauge, the private sector wage component of the Employment Cost Index (ECI), for Q1 that was released last week. This note looks at the above in a bit more detail.
Key takeaways:
Over the quarter labor productivity growth in Q1 eased and became negative, while the year/year growth rate dropped from 2.1% to 1.4% in Q1. The latter is below the pace of my estimate of trend labor productivity growth.
The labor share grew again at a substantially higher pace over the quarter. It, however, remained slightly below its trend estimate, which is estimated to have declined 0.8% year/year in Q1. By comparison, my trend labor share estimate for 2018 was essentially stable around 61.5%.
The Q1 ECI index for wages (excl. incentive pay) of private sector workers went up 3.4% year/year. This is about 0.5 percentage point above the trend wage growth rate consistent with 2% PCE inflation given the trend growth rates of labor productivity and the labor share.
Throughout 2024 the overshoot in ECI wages of private sector workers was mainly driven by above trend year/year labor share growth (workers were increasingly getting a larger share of business revenues relative to longer term trends) and also above trend labor productivity growth. In Q1 almost the entire overshoot in ECI private wage growth relative to the 2% inflation pace was due to elevated near-term inflation expectations of firms and households.
The favorable impact of temporarily elevated productivity growth on prices and wages rate has started to fade going into 2025, with large import tariffs likely pushing down productivity growth further. With sharply accelerating inflation expectations, wage growth will likely remain above the 2% inflation pace in 2025.
Labor Productivity
Labor productivity for the non-farm business sector contracted 0.8% quarter/quarter AR in Q1, after an upwardly revised 1.7% increase in Q4. On an annual basis labor productivity growth eased from 2.1% year/year to 1.4% in Q1. However, how does this compare to its underlying longer-term trend?
Without wanting to resort to some structural model, I base my estimate of trend productivity on a number of different purely statistical approaches as outlined here and use an average of the estimates from these approaches as the trend labor productivity estimate. As such this average reflects the uncertainty with respect to the 'true' trend level of labor productivity.

This estimate of trend labor productivity is plotted in in the first chart above (orange line). A comparison between the current vintages of actual labor productivity and my trend estimate suggests that after a long period of declines labor productivity turned a corner in Q1 2023 and started to converge back to trend in 2024. In the most recent quarter labor productivity fell below trend again.

The next chart, see above, depicts actual and trend labor productivity in terms of year/year growth rates. Trend productivity growth was estimated at around 1.6% year/year in Q1, pretty much in line with the average trend labor productivity growth rate in 2016-2019. So, no evidence of an acceleration in trend labor productivity growth as of yet, despite all the AI chatter in markets and the media. The above-trend labor productivity growth rates in 2023-2024 thus likely reflected a catch-up dynamic rather than accelerated trend labor productivity growth.
This chart also makes clear that above-trend labor productivity growth over the 2023-2024 period was a factor that kept inflation in check and contributed to disinflationary episodes during that period. In Q1 this tailwind turned into a slight headwind with labor productivity growth easing below trend, which means that it cannot act as an absorber of increasing import costs of firms owing to the broad-scale tariff hikes announced since “Liberation Day”. Below-trend labor productivity growth is another reason why one should expect inflation to pick up relatively quickly as a consequence of the administration’s tariffs policy.
Of course, the recent productivity slowdown might be due to temporary factors, and we could see a return to above-trend labor productivity growth in Q2 as the actual level converges back to the estimated trend level (as it did in 2024 — see the first chart at the top of this section). However, there are a number of reasons to assume that persistently higher, across-the-board import tariffs can be detrimental to labor productivity:
As high tariffs shield domestic industries from foreign competitors, less productive firms are more likely to endure and drive economic activity.
Related to the above, with higher tariffs impeding on import competition, domestic firms have less of an incentive to invest in efficiency improvements.
High, across-the-board tariffs distort the scope of collaboration and knowledge-sharing between domestic and foreign firms, providing more limited opportunities for technological advance.

There is also empirical evidence that tariffs indeed can persistently impact labor productivity in an adverse manner. The Council on Foreign Relations has shown that the introduction of 25% tariff on steel imports in March 2018 resulted in a 32% reduction in labor productivity in the steel sector between 2017 and 2024. On an economy-wide scale similar effects hold as well: Furceri et al. (2019) show for the 1963-2014 period across 151 countries that tariff hikes result in significant declines in productivity over the medium-term, especially when introduced during economic expansions. Finally, Klein and Meissner (2025) look at the relationship between tariffs and labor productivity across several US manufacturing sectors between 1870 and 1909, a period often cited by President Trump as an inspiration for his own trade policy. Klein and Meissner show that the period’s high tariffs resulted in a meaningful reduction of labor productivity (see chart above).
While “Liberation Day” was followed by a “pause”, this really reset the originally announced reciprocal tariffs to 10%, far above the 2%-3% average effective tariffs in the U.S. over the recent period. Remarks from the administration since then as well as preliminary trade deals, such as the recent UK-US trade agreement, suggest 10% is the lower bound for U.S import tariffs for now. With much higher U.S. import tariffs almost certain to persist for the foreseeable future the resulting slowdown in labor productivity growth will most likely exacerbate the impact of the tariff hikes on inflation and potentially result in a longer-lasting inflation acceleration.
The Labor Share
The labor share represents the compensation firms pay their workers as a share of the firms’ revenues. This measure is useful to have alongside labor productivity data, as higher labor productivity in principle should result in higher real wages but the extent to which this happens depends on this labor share.
In Q1 growth of the labor share for the non-farm business sector accelerated on a quarter/quarter basis for the second consecutive quarter, from +0.17% quarter/quarter AR to +2.1% in Q1. On an annual basis Q1 labor share growth was about -0.9% year/year vs. -0.1% in Q4. As was the case for labor productivity discussed earlier, I use an average across different purely statistical approaches (outlined here) to pin down the trend labor share.
The orange line in the chart above depicts the trend component of the labor share. Throughout 2016-2018 this trend labor share was broadly stable around 61.5%, but it has been on a declining trajectory since 2019. Trend labor share growth in Q1 was about -0.8% year/year. The current vintage of labor share data suggests that in Q1 the labor share was a notch higher than its estimated long-run level of 59.6%.
Q1 Wage Growth: Interpreting the Recent ECI Moves
The Employment Cost Index (ECI) is seen as the Fed’s favorite gauge of labor compensation growth, as it corrects for any compositional shifts across sectors (much like the Atlanta Fed Wage Growth Tracker). The Q1 ECI report was published on April 30th. The most important measure from this report is the ECI for wages of private sector workers (ECIWP), stripping out non-wage labor compensation (i.e., incentive pay) as well as public sector wages. ECIWP was up 3.4% year/year in Q1, a slightly slower pace of growth than the 3.7% for Q4.
Much in the same way I do for monthly wage measures, one can use the trend estimates for labor productivity and the labor share outlined above to get a trend wage growth estimate consistent with the Fed’s 2% inflation target. This simply equates to 2% plus the year/year growth rates implied by the earlier discussed trend estimates of labor productivity and the labor share.
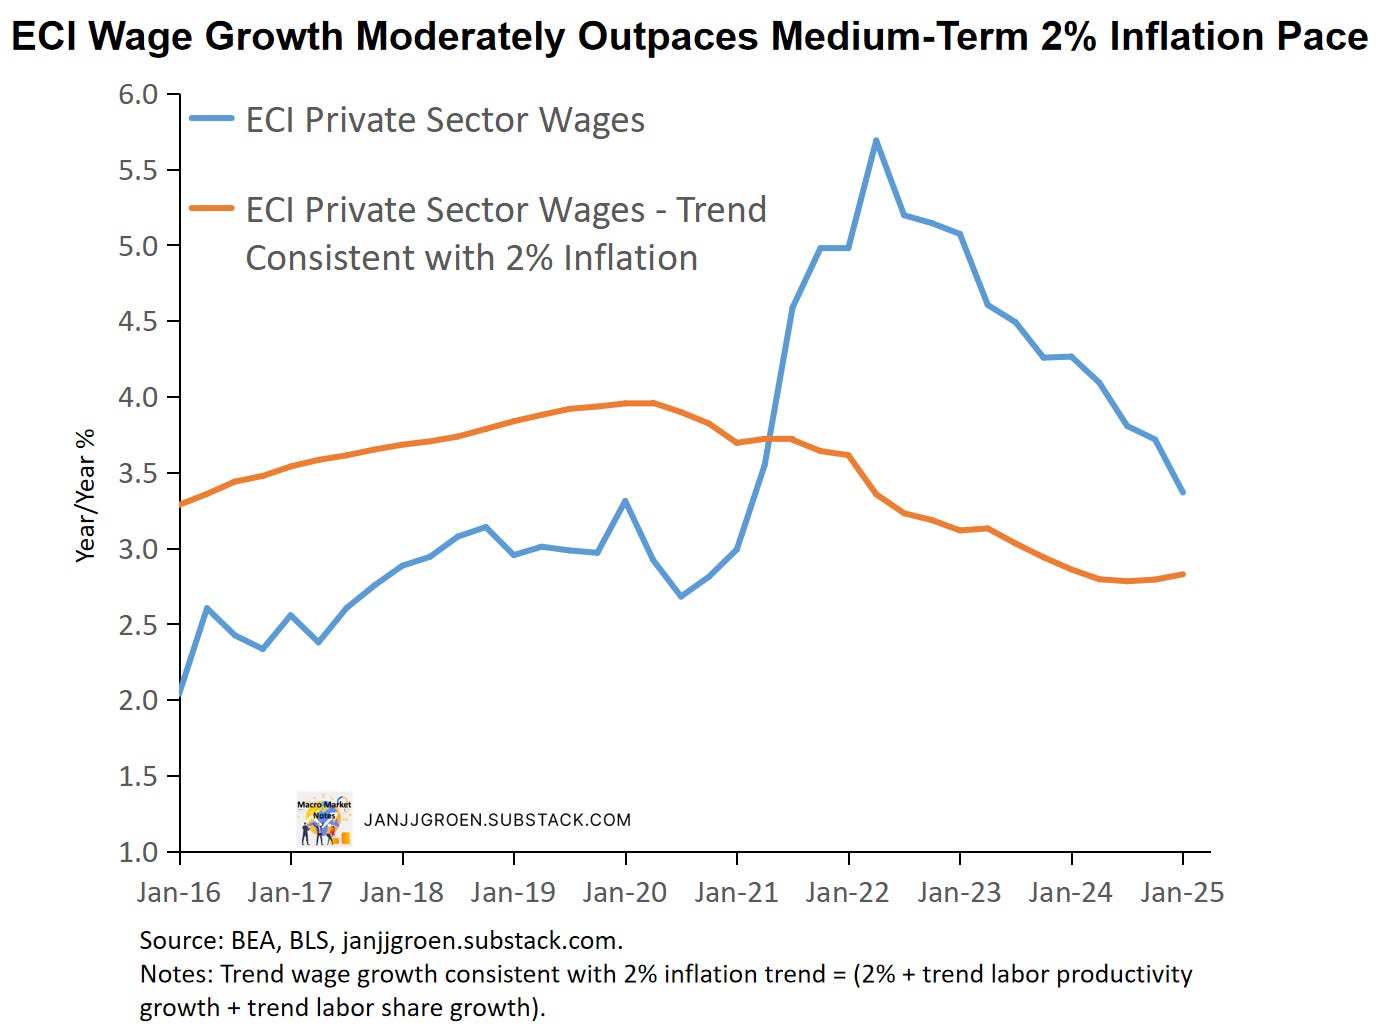
The chart above contrasts this trend wage growth measure with actual ECI wage growth, and recent wage growth remains this trend value. More specifically, for Q1 ECI wage growth equal to 3.4% year/year was about 0.5 percentage point above the rate of growth that would be consistent with 2% PCE inflation. This is still an economically meaningful overshoot of wage growth vs. the inflation target trend, but the magnitude of the overshoot currently is the lowest since Q3 2021.
So, what drove the recent overshooting of wage growth compared to the pace consistent with 2% inflation? To do that I decompose the gap between actual ECI wage growth and its 2% inflation consistent trend using the deviations of actual year/year growth relative to estimated trend growth for both labor productivity and the labor share, the gap between year-ahead inflation expectations of firms and households (“Main Street”) compared to the 2% inflation target, and an unexplained residual.
The “Main Street” inflation expectations are extracted as the common trend across a number of surveys, as I described in an earlier post. After incorporating March and April updates of most firm and household surveys, these year-ahead “Main Street” expectations accelerated in Q1 2025 to, on average, about 2.9% in terms of year/year PCE inflation from 2.5% in the previous quarter and accelerated further to 4.2% in April - see here for more details on recent developments.

The chart above shows that since mid-2021 the ECI private sector wage growth gap has been persistently positive (above a pace consistent with 2% over the medium term), as the inflation expectations gap turned positive in a sizeable way. Throughout 2023 and early 2024 the impact of above-trend inflation expectations declined whereas the impact of above-trend labor productivity gained in importance. And in 2024 the contribution of above trend labor share growth (blue bars in the chart above) also rapidly increased, as it, like labor productivity, converged back to its trend estimate.
Focusing on Q1 in the chart above, the inflation expectations gap equaled +0.88 percentage point, up from +0.48 percentage point in Q4, whereas the labor productivity growth gap contribution decreased from +0.40 percentage point to -0.20 percentage point in Q1. Similarly, the labor share gap contribution dropped in Q1 from +0.82 percentage point in Q4 to -0.08 percentage point. With negligible or negative contributions from the labor share and labor productivity, elevated inflation expectations once again became the main driver behind wage growth.
Beyond Q1, “Main Street” inflation expectations as of April suggest that the inflation expectations gap could potentially contribute a lot more to ECI private wage growth in Q2 2025 and beyond. With the gaps between the current and trend levels of labor productivity and the labor share closing these components are not likely to compensate much for the rising impact of accelerating inflation expectations. Thus, unless the labor market deteriorates notably this year and drags down the growth rate in the workers’ share of business revenues relative to its trend, elevated inflation expectations of firms and household likely will keep wage growth above inflation target-consistent pace.