


Dec CPI & Retail Sales and Jobless Claims Trends
December core inflation eased but trimmed means were firm. Real retail sales slowed in Q4. Initial claims increased but did not impact the labor market.

This post reviews trends from the most notable data releases this week: the December CPI and retail sales reports as well as the weekly jobless claims data.
Key takeaways:
Core CPI inflation eased in December but, nonetheless, trimmed mean CPI measures suggest that in terms of underlying PCE inflation disinflationary trends likely have bottomed out for now.
Inflation-adjusted retail sales were solid both for core goods in Q4 but contracted for real core goods excl. motor vehicles and bar/restaurant spending.
Initial jobless claims for early January picked up, contrary to usual dynamics at this time of the year, but it did not impact the labor market just yet.
Updated CBO population projections confirm that jobs growth and initial claims had at times, a hard time with the immigration-induced population growth acceleration in 2023 and 2024.
The recent data suggest the Fed will remain on hold at its January FOMC meeting.
December CPI: Good News but Be Cautious
The topline numbers of the December CPI report were mixed. Headline CPI increased 0.4% (forecast: 0.3%) over the month in December after rising 0.3% in November, whereas core CPI inflation was +0.2% m/m (three-digits: +0.225 compared to +0.308% in November) vs. a +0.3% forecast.
To get a feel of real underlying CPI inflation, one can look at the Cleveland Fed's trimmed mean CPI measures, which cast away excess volatile elements by either taking the median (price change of the CPI component at the 50th percentile across all price changes) or a 16% trimmed mean (weighted average of price changes once both the top 8th percentile and lowest 8th percentile of price changes are deleted). Median CPI inflation accelerated from +0.2% month/month to +0.3% in December, and the 16% Trimmed Mean CPI inflation rate was essentially stable at around +0.3% month/month. So, the trimmed mean inflation measures (a.k.a. underlying inflation) appeared stickier in December relative to core CPI inflation.
As usual a big driver behind CPI inflation dynamics was its CPI Rent of Shelter component (OER+Rent), which remained broadly unchanged in December at +0.3%. Between November and December out of the four Census regions the Midwest and Northeast showed a slower month/month OER inflation rate while the other two (South and West) showed an acceleration.

For most Census regions (except the South) the year/year OER inflation rates in the chart above remained above pre-COVID levels in December. Year/year rates are easing gradually, but it remains to be seen if these will return to pre-COVID paces across all of the U.S. Note, though, that while housing services drives about 40% of core CPI, it determines less than 20% of core PCE, the Fed's preferred price measure. Disinflation therefore needs to be more broad-based and the trimmed mean CPI inflation metrics suggests that this may not be the case.
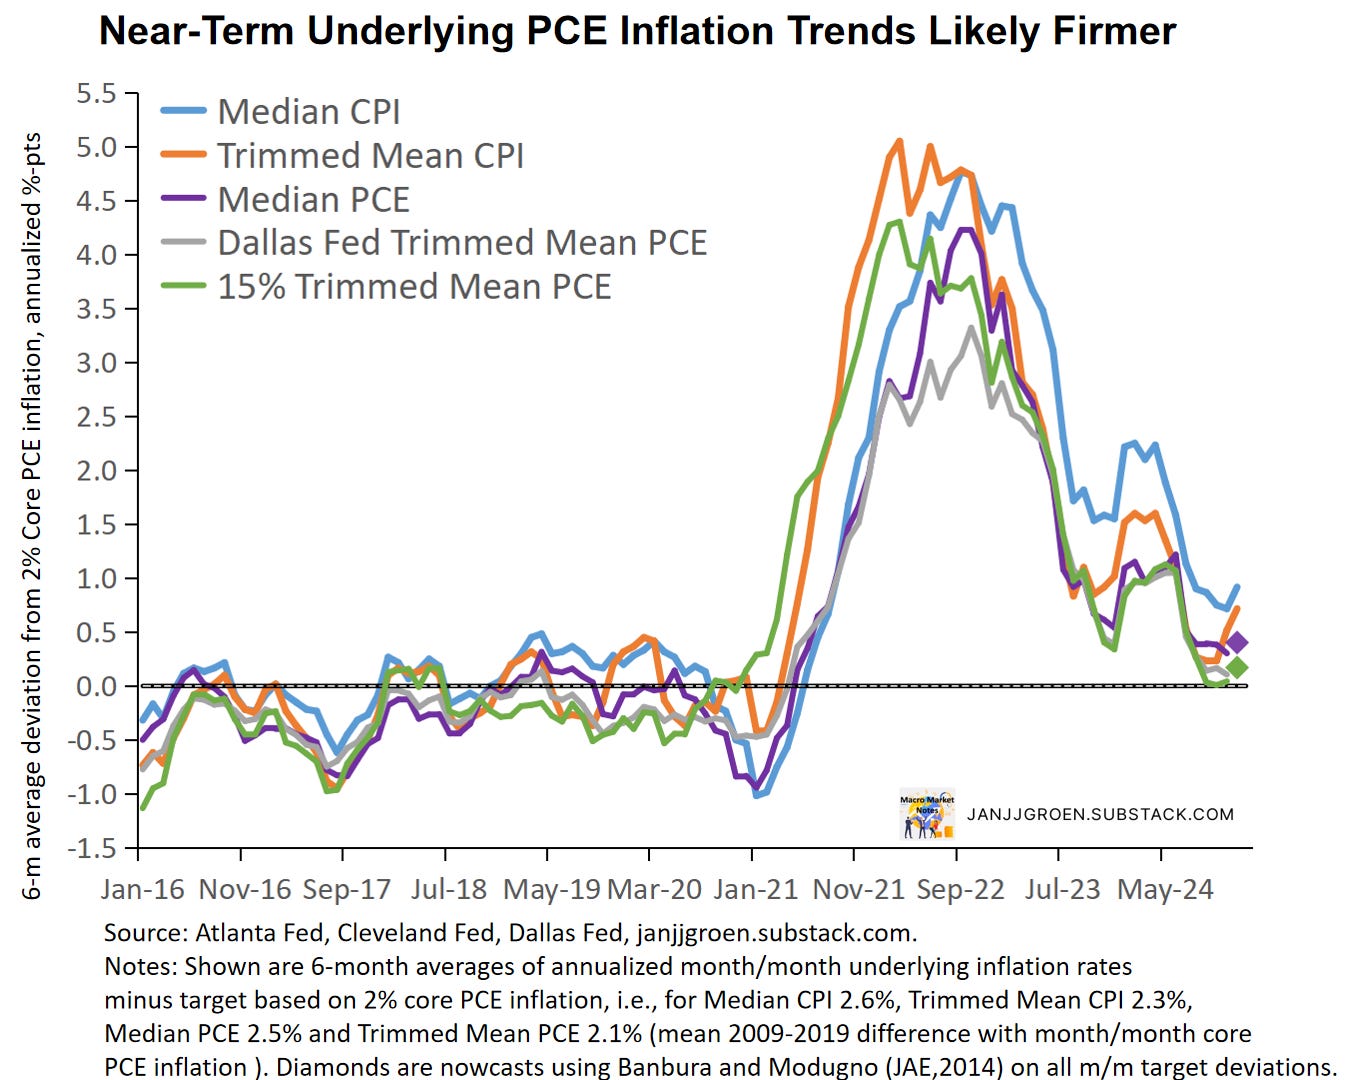
Both the Median CPI and 16% Trimmed Mean CPI inflation rates in the chart above are overshooting the Fed's 2% inflation target over a six-month period (at 3% and 2.6% in core PCE terms, resp.). Furthermore, both 6-month average measures increased over the month and thus moved further above the target.
When using the strong correlation between the CPI and PCE trimmed mean inflation series, statistical nowcasts of Median and Trimmed Mean PCE inflation rates (due later this month) suggest near-term underlying PCE inflation trend measures ticked up in December but remain somewhat below 2.5% in core PCE terms (diamonds in the chart above). So, the nowcasts of underlying PCE inflation dynamics make clear that the disinflation trend has bottomed out, at least for now.
December Retail Sales: Weaker Real Goods Spending
Retail trade (i.e. retail sales pertaining to goods) went up 0.4% over the month in December, after it increased 0.8% month/month in November. As always, it's crucial to remember to not take these figures at face value without looking under the hood:
Retail sales measures spending on goods as well as bar/restaurants spending. Thus, it really mostly measures goods consumption which is a relatively small slice of the monthly consumption basket, as about 2/3 of U.S. consumption expenditures relates to services.
Retail sales data does not correct for changes in prices, which for goods in particular can make a big impact: core goods prices in the December CPI report went up 0.05% month/month. As such weaker retail sales growth, for example, could merely reflect more the pace of price increases while retail sales volumes were solid.
Deflating retail sales with CPI or core CPI overlooks the predominantly goods-focused nature of retail spending.
Dissecting retail trade data into subcomponents and aligning them with corresponding CPI subcomponents provides a more accurate assessment. Firstly, when it comes to retail trade data (that is, retail sales minus nominal bar and restaurant spending) I use the CPI Commodities, CPI Gasoline, CPI New & Used Vehicles and CPI Motor Vehicle Parts & Equipment indices to inflation adjust over retail trade as well as components related to sales at gasoline stations and motor vehicle dealers & parts. In case of bar and restaurant spending I deflate that component by means of the CPI Food Away from Home index.
Furthermore, I apply chain-weighting based on the Fisher index approach using current period and previous period prices and quantities of retail trade and the gas and motor vehicle components to parse out the impact of the latter two volatile components. This approach allows for time-varying weights, as prices and quantities change from period to period and consumers substitute between the different spending categories. It is the same methodology used by the BEA to compute real consumption and GDP.

Core goods spending remained strong in inflation-adjusted terms on a three-month basis, as is evident from the chart above. Real core goods spending excluding motor vehicles, however, contracted on a three-month basis in December (orange line in the chart above). Likewise, after strong growth in October and November inflation-adjusted bar and restaurant spending slowed and contracted 0.5% three-month AR (purple line in the chart above). Strong inflation-adjusted motor vehicles spending was the main driver of still strong real core goods spending in Q4.

The chart above indicates that the weak three-month growth pace of inflation-adjusted core goods spending excl. motor vehicles was due to contracting monthly real sales in October and November by -9% and -16.9% AR respectively (orange line). Real core goods spending excl. motor vehicles recovered in December to about 2% AR. In terms of inflation-adjusted bar and restaurant spending the weak December three-month growth rate was due to contraction in November in December (purple line in the above chart): after recording +7.9% AR, we had -2.4% AR in November and -6.5% in December. This recent contraction in real bar and restaurant spending is in line with a drop in consumer confidence in December that reflected increased policy uncertainty owing to possible policy action of the incoming Trump 2.0 administration.
This Week’s Initial Jobless Claims Trends
After a drop in initial claims for the week ending January 4th, data for the week ending January 11th showed a reversal of the preceding week’s move at 217,000 persons versus 203,000 previously.

When I focus on non-seasonally adjusted data and compare today’s data with data from previous years in the same week it suggests that the rise over the first two weeks of the year is not in line with the typical dynamic of this time of the year with the most recent week at the top of the range in previous years (chart above). Some of the move, of course, is due to the wildfire disaster hitting California recently, with initial claims for this state rising 13,074 over the month. However, initial claims in Michigan grew at even stronger pace at 15,175. Initial claims in New York declined the most over the week at -15,075.
In terms of the unemployment outlook, initial claims are usually considered as a high frequency, real-time indicator of layoffs. What is relevant in that context is whether the layoff rate as implied by initial claims is significantly high or low to put substantial upward or downward pressure on the unemployment rate. To assess this, I laid out earlier a methodology to determine a benchmark rate for initial claims for the current month that equals the maximum number of initial claimants that will keep the unemployment rate constant relative to the previous month. If current initial claims rise above this claims benchmark rate, initial claims could potentially start to add to the unemployment rate.

The chart above compares (seasonally adjusted) initial jobless claims and its four-week moving average with the claims benchmark rate based entirely on BLS data (orange line) as well as a claims benchmark rate that instead incorporates the CBO’s more aggressive population projections for 2020-2024 (purple line). This CBO population projection reflects the 2025 update published on January 13, which incorporates stronger net immigration estimates than the Census estimates used by the BLS.

Previously I used the 2024 CBO population projections to correct the labor force estimates for 2023 and 2024 (gray line in the chart above). In the 2025 projection the CBO upgraded the growth rate of the noninstitutionalized population from 0.8% to 1.38% for 2023 and from 1.38% to 1.39% in 2024. This projection also upgraded population growth estimates for 2020-2022. The orange line in the chart above incorporates these updated numbers and indicates a somewhat faster labor force growth for 2023 vs. the gray line. Both CBO-based corrections suggest stronger growth of the U.S. labor supply for especially 2023 and 2024 (blue line vs orange & gray lines in the chart above).
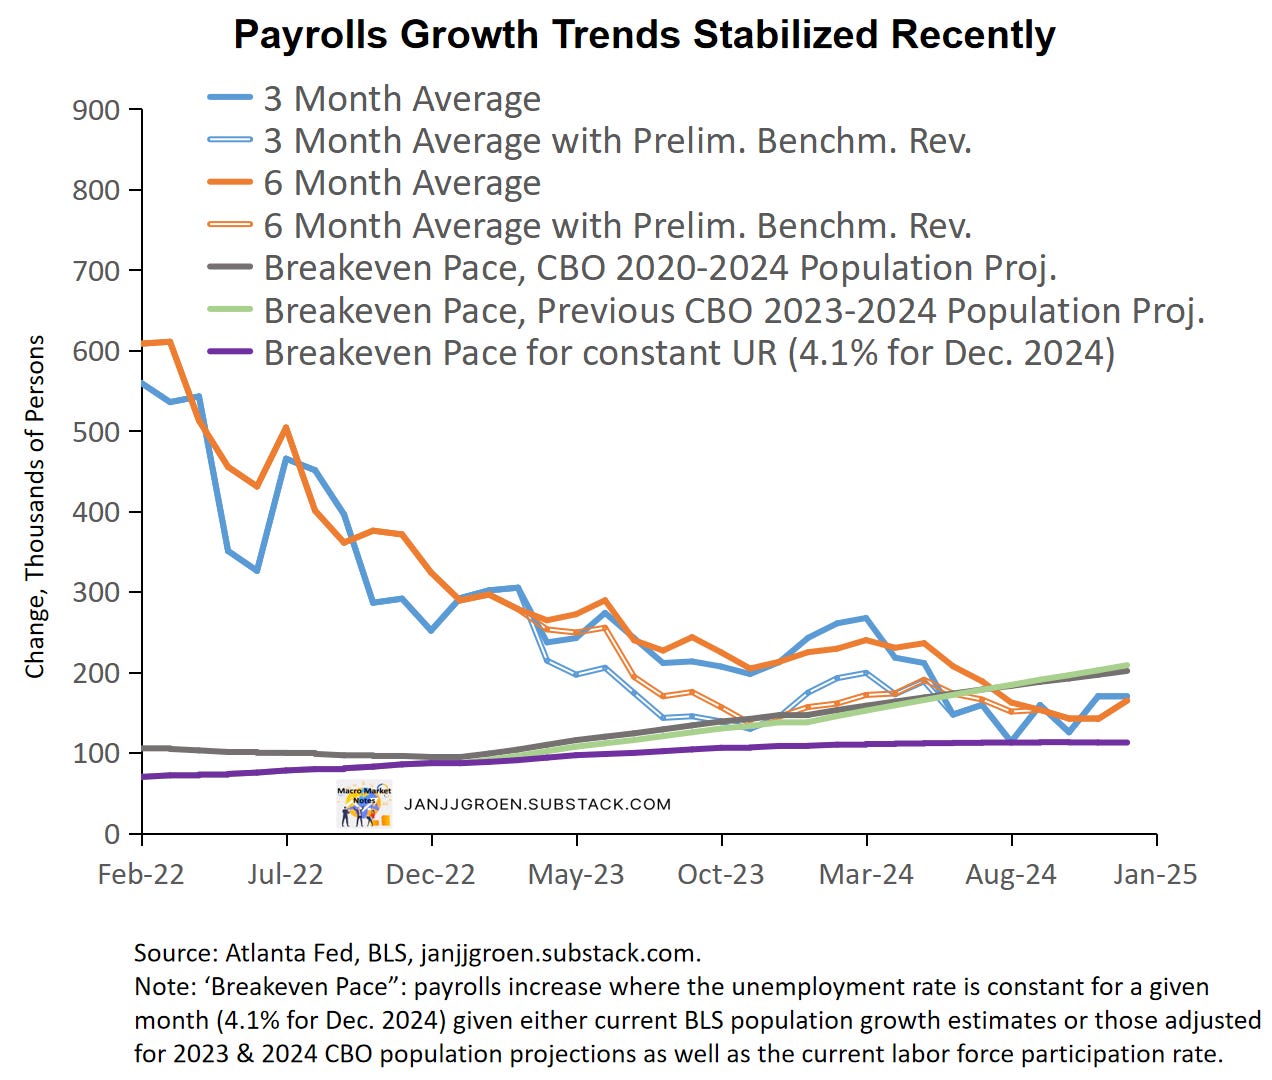
The more aggressive population growth projections clearly have lowered the benchmark rate for claims in 2023 and 2024. Similarly, whether we use the 2024 or the 2025 CBO population assumptions, the breakeven pace for nonfarm payrolls have been a lot higher the last two years than implied by the BLS population estimates (chart above). Consequently, since H2 2023 payrolls growth was too low to meaningfully outpace implied benchmark rates/breakeven paces that would have kept the unemployment rate constant, especially when incorporating the preliminary 2024 payrolls benchmark revision.
The 2025 CBO population projections also had an alternative estimate that left population growth in line with BLS estimates through 2024 and then switching to CBO projections for 2025 and beyond. This suggests that we should expect a large upward population correction in the January jobs report, as new immigration projections from Census were also more in line with those from the CBO.
As of January, the CBO expects noninstitutionalized population growth to slow from 1.39% in 2024 to 0.95% in 2025. This slowing reflects an assumed weaker immigration growth as the Biden administration already clamped down on immigration earlier in 2024. This will relieve some of the pressure on the labor market in the short term, but likely also slowdown real activity growth and increase inflationary pressures going forward.
Given the messages from the underlying trends in the December CPI report, a solid December jobs report, and still solid labor market at the start of January, expect the Fed to remain on hold at its January FOMC meeting. The Fed will be cautious about further cuts (if any) in 2025, especially given the uncertainty about tariffs and, in particular, immigration that could exacerbate the already likely slowdown of population growth in 2025.