


Dec. Payrolls: A Happy Ending of 2024
December payrolls growth surprised to the upside, with an easing unemployment rate and an improving job-finding rate. Wage growth remains elevated.

Today’s release of the December Employment Situation report was another report where special factors that impacted the labor market: the December acceleration in jobs growth was very much driven by the retail sector, reflecting the late start of the holiday sales season owing to the timing of Thanksgiving and Christmas. Payrolls growth accelerated and the unemployment rate eased owing to a notable improvement of job-finding probabilities for an unemployed person. Wage growth remained elevated compared to trends.
Key takeaways:
Payrolls growth picked up the pace in December, but near-term trends still run below the breakeven pace needed to keep the unemployment rate constant at current levels given higher-than-expected population growth.
The unemployment rate decreased to 4.1% as the labor force participation rate remained unchanged at 62.5%.
The job-finding rate improved over the month to 48% with smoothed trends at around 45%. The unemployment rate consistent with recent job-separation and job-finding rates decreased; smoothed trends suggest that in the near term the unemployment rate will likely stabilize around 4.1%-4.2%.
Wage growth in composition-adjusted average hourly earnings remains elevated at paces inconsistent with both the 2% inflation target and near-term inflation expectations.
Today’s data means there’s no urgent need for the Fed to cut its policy rate again at the upcoming January FOMC meeting; the forthcoming December inflation data will be more of a determining factor for such a move.
December Jobs Growth: Sturdy Again
The December jobs report released today indicated that payrolls in the establishment survey grew more than the consensus expectation as they were up by 256,000 persons in December, compared to a 212,000 increase in the preceding month (which was revised down from 227,000 initially). Payrolls growth for October and November combined were revised down by 8,000 persons.

The unemployment rate ticked down 10bps to 4.1% in December. In three-digit terms the unemployment rate eased from 4.231% in November (revised down owing to updated seasonal factors) to 4.086%. The updated seasonal adjustment factors in the household survey in this report led to notable unemployment rate changes in March and July: March went from 3.8% to 3.9% and July was downgraded from 4.3% to 4.2%. Household employment grew in December: from -273,000 persons in November (revised up due to updated seasonal adjustment) to 478,000 (chart above). As shown in the chart above, household survey-based employment growth caught up with payroll growth, which is a regular historical pattern. The labor force increased by 243,000 persons, after decreasing 124,000 in the previous month. The population grew of 175,000 persons in December with the labor force participation rate remaining unchanged at 62.5%.
Underlying Labor Market Trends

Moving beyond the month-to-month movements, the chart above shows three- and six-month moving averages of payrolls changes from the establishment survey since February 2022. With minimal revisions to the October and November data smoothed trends in payrolls growth appear to have stabilized recently at around 175,000 persons on a three-month average and are above the breakeven pace needed to keep the unemployment rate constant in a given month based on Census-based BLS population numbers (purple line in the above chart). This does not change after naively incorporating the results of the Preliminary Benchmark revision published in August, as I did at the time (blue and orange dashed lines in the chart above).
Note that the estimate of the breakeven pace that keeps the unemployment rate constant in a given month is conditional on the BLS’ population growth estimates as well as the labor force participation rate in that month. There’s been a lot of public discourse on the validity of the population growth projections from the U.S. Census that are used by the BLS. In particular when it comes to net immigration projections the Census has been criticized a lot. For example, the CBO’s population projections assume more aggressive net immigration numbers for 2023 and 2024, resulting in noninstitutionalized population estimates of about 268 million in 2023 (vs about 266 million from Census) and about 271 million in 2024.
The chart above also includes an adjusted breakeven payrolls growth pace for a constant unemployment rate, which adjusts the BLS’ population projections for 2023 and 2024 to bring them line with the CBO’s 2023 and 2024 noninstitutionalized population estimates (gray line in the chart above). By comparing the trends in (revised) payrolls to this adjusted breakeven pace it seems the even in December near-term payrolls growth trends falls short of keeping up with the higher CBO population growth projections. The CBO-implied breakeven pace needed to keep the unemployment rate at 4.1% is around 208,000 persons in December vs. about 113,000 using the BLS population estimates. Without a slowdown in the population growth in 2025 this likely means some upside risk to the unemployment rate in the near-term.
Additional details about the underlying strength of the labor market can be inferred from the household employment survey. Following Shimer (AER, 2005) and Shimer (RED, 2012), we can use data on total unemployed and employed persons as well as the number of people that are unemployed for less than 5 weeks to estimate:
Job-finding rate: the probability an unemployed person in month t will find a job or leaves the labor force. This is calculated assuming that total unemployment in month t+1 equals month t unemployment plus the number of people unemployed for less than 5 weeks in month t+1.1
Job-exit rate: the likelihood an employed person in month t will exit its job either due to layoffs, quits or retirement, which depends on data on the job-finding rate, unemployment and labor force.2

The chart above shows a plot for the estimated job-exit rate. This job-exit rate has been relatively stable over the past two years, with a moderate downward shift in the first half of 2023 that stabilized between June and October but then rose again until this summer. Note, however, that the y-axis in the chart above also makes clear that the variability in the separation rate has been really modest.
The job-exit rate jumped up between June and August and but has been decreasing notably between August and November (chart above). The odds of a job exit picked up slightly from November going into December, essentially keeping it unchanged consistent with relatively stable layoff and quits rates for November.
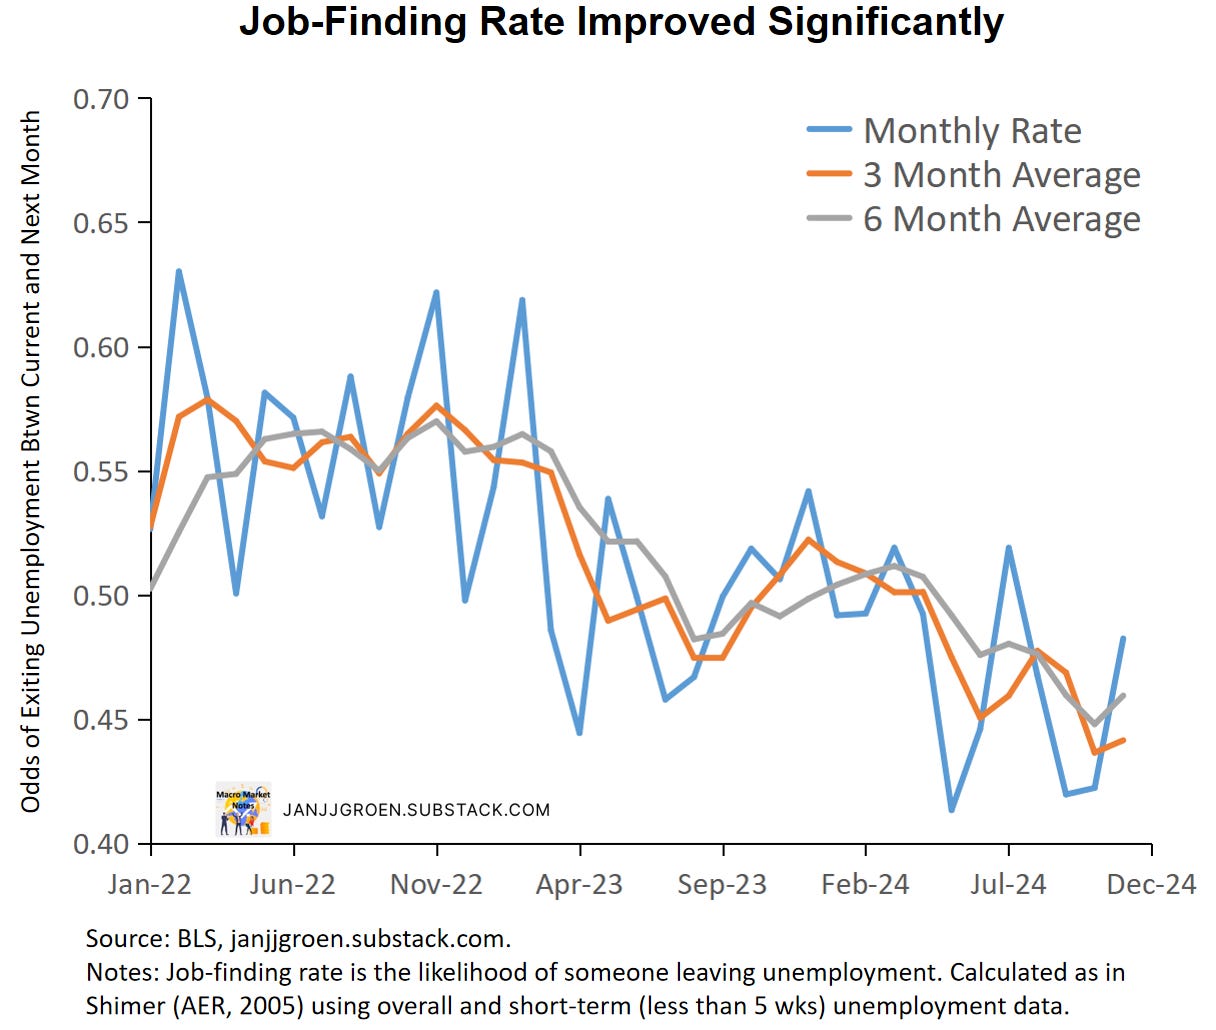
In 2023 the job-finding rate declined a lot after Q1 2023 (chart above) and this decline generally continued in 2024 to about 42% for October going into November. In December both the overall number of unemployed persons as well as the number of newly unemployed persons (less than 5 weeks in duration) declined over the month: -235,000 vs. -52,000. Given that overall unemployment declined more than newly unemployment, the likelihood to exit unemployment between October and November improved notably, with the job-finding rate going up from about 42% to about 48% for November going into December (chart above). Three- and six-month averaged job-finding rates for November into December settled at around 45%.
As in Shimer (AER, 2005) we can combine the above discussed job-exit and job-finding rates to calculate a flow-consistent unemployment rate and the chart above plots both the corresponding monthly rate and the three-month average of this rate. The (three-month average) flow-consistent unemployment rate is the unemployment rate that prevails when the job-exit and job-finding rates remain constant at their current (three-month average) levels. Deviations compared to the official unemployment rate should dissipate over time and often leads changes in the official rate.

The chart above shows clearly that a stable job-exit rate and an improving job-finding rate led to a substantial drop in the monthly flow-consistent unemployment rate for November into December. The most recent flow-consistent unemployment rate is now at the lowest level since March.
Given the choppiness in this measure, it’s probably more useful to look at three-month averages. Since January the flow-consistent unemployment rate on a three-month average basis has been outpacing the official unemployment rate and leading the rise in the latter (solid blue and orange lines in the chart above). This was largely driven by a deterioration in the job finding rate over that period, which reflects labor demand weakening. More recently, three-month averages of headline and flow-consistent unemployment rates suggest that over the near term the unemployment rate will likely stabilize around 4.1%-4.2%.
Despite the strong in payrolls growth in December, when taking into account higher-than-expected population growth, either smoothed payrolls growth trends need a pickup in pace or population growth needs to slow in order to avoid a rising unemployment rate. The household survey shows tentative signs of a recovery in the job-finding rate and if this would stay at this rate it would likely keep the unemployment rate from meaningfully rising beyond 4.2%.
Wage Growth Remains Elevated
Average hourly earnings of all private sector employees grew 0.3% month/month in December, down from 0.4% in November, and accelerated in year/year terms from (a downwardly revised) 4% in November to 4.6%. For production and non-supervisory workers, hourly earnings eased to 0.2% month/month in December, down from (a downwardly revised) 0.3% in the preceding month, and on a year/year basis growth accelerated from (a downwardly revised) 3.9% to 4.3% in December.
NOTE: In the report the year/year growth rate for all private sector employees equals 3.9%, which was generally received by Wall Street analysts and media as a sign of easing wage pressures. The report’s year/year rate, however, is based on seasonally adjusted data. I prefer to use non-seasonally adjusted data, if available, when calculating year/year growth rates, as the seasonal smoothing is unnecessary in that case. As wages do not get reset every month that also means a choppier year/year growth rate.
The wage data from the jobs report are notoriously noisy, given that they are revised often and do not correct for the sectoral and skills composition of jobs growth over the month. There are better quality wage data available, such as the Atlanta Fed Wage Growth Tracker and the Employment Cost Index, but the Atlanta Fed does construct a rudimentary composition correction for average hourly earnings from the jobs report, which can be found here.
Indeed, as the lateness of Thanksgiving and Christmas in 2024 meant a later than usual start of the holiday sales season, a large driver behind the December jobs growth was increased hiring in the retail sector. Jobs in this sector generally have relatively low hourly wages so composition effects could have been big for the December wage data. When applying the Atlanta Fed composition correction on the monthly average hourly earnings for December, they went up from the official 0.3% to 0.4%, and for production and non-supervisory workers the correction pushed up the month/month growth rate from an official 0.2% to 0.3%.

We can observe from the chart above is that the year/year wage growth rate indeed picked up. On a three-, six- and twelve-month basis composition-adjusted wage growth have running around 4% for most of 2024.
I can combine labor productivity and labor share trend estimates with the 2% inflation target, along the lines I have done in my “Wages and Inflation Expectations” notes and incorporating the Q3 update of productivity data to get a medium-run annual wage growth rate consistent with 2% inflation.

Additionally, instead of the 2% target one can use my “Main Street” year-ahead inflation expectations proxy, i.e., the common trend across survey-based near-term inflation expectations from firm and consumer surveys. After incorporating December survey data this trend in near-term inflation expectations eased since Q3 to 2.45% in year/year PCE inflation terms in December (chart above).

Compared to both the composition-adjusted AHE data for production and non-supervisory workers for December and the unsmoothed Atlanta Fed wage tracker into November, annual wage growth rates still outpace the 2.6% pace consistent with 2% PCE inflation in the medium term (green line in the above chart). In fact, wage growth also runs above the wage growth pace consistent with 2.45% PCE inflation implied by “Main Street” near-term inflation expectations (blue line in the chart above).
January FOMC Meeting
After the conclusion of the December FOMC meeting the Fed clearly signaled that with a further 25bps rate cut it had completed recalibrating its policy rate, and that from thereon it would ease policy rates at a more moderate pace. The Fed also signaled a return to more emphasis on inflation data relative to labor market trends when assessing possible rate cuts. The December jobs report really signaled a stabilized labor market and from that perspective there’s no urgent need to cut rates again at the upcoming January FOMC meeting. In fact, unless the forthcoming December inflation data is much weaker than expected, I expect that the Fed will remain on hold at the January FOMC meeting. With wage growth momentum remaining stubbornly elevated as well as a pick-up in underlying inflation momentum and household spending growth the Fed’s appetite for rate cuts is, for now, low.
Given this calculation, the job-finding rate will run up to November utilizing data on (short-term) unemployment for December.
As the calculation of the job-separation rate depends also on (short-term) unemployment for December, we cannot go beyond November.