


Oct Personal Income & Outlays: Uncertainty
Consumption spending growth eased somewhat but remains strong. Near-term trends in underlying inflation rates are at 2% but momentum is clearly turning upward.

The October Personal Income and Outlays report provides a good insight on the U.S. consumer as well as inflationary pressures going forward. This note presents some of these insights.
Key takeaways:
Personal income growth out of wages and salaries was revised down over the past six month but picked up the pace in October. Household wage income growth continues to overshoot the pace that’s consistent with 2% PCE inflation over the medium-term.
The stock of excess savings has NOT run out and continues to be a tailwind for consumption. Between September and October, it fell around $14 billion and equaled about $419 billion in October.
Headline consumption growth eased somewhat in October but remains above its underlying spending growth. The underlying pace of consumption spending itself went up notably in September and October, likely due to strong household wage income growth and still sizeable excess savings. Consequently, do not expect a large downshift in consumption is forthcoming over the near term.
The central tendency measures of PCE inflation are mostly at 2% on a six-month basis. However, these measures have been accelerating on a three-month basis since August and over an annual horizon underlying inflation rates have stabilized in the 2.5%-2.6% range.
Developments in spending growth, wage income growth and underlying inflation momentum suggests we are close to an upward turning point in the dynamics of inflation. Given where underlying inflation was over the past six months, the Fed will likely cut rates again in December, but it’ll be very cautious easing rates further in 2025.
Wage Income Growth Revised Down but Remains Strong
There were notable downward revisions to the recent path of household income out of wages and salaries were in the October report (chart below).
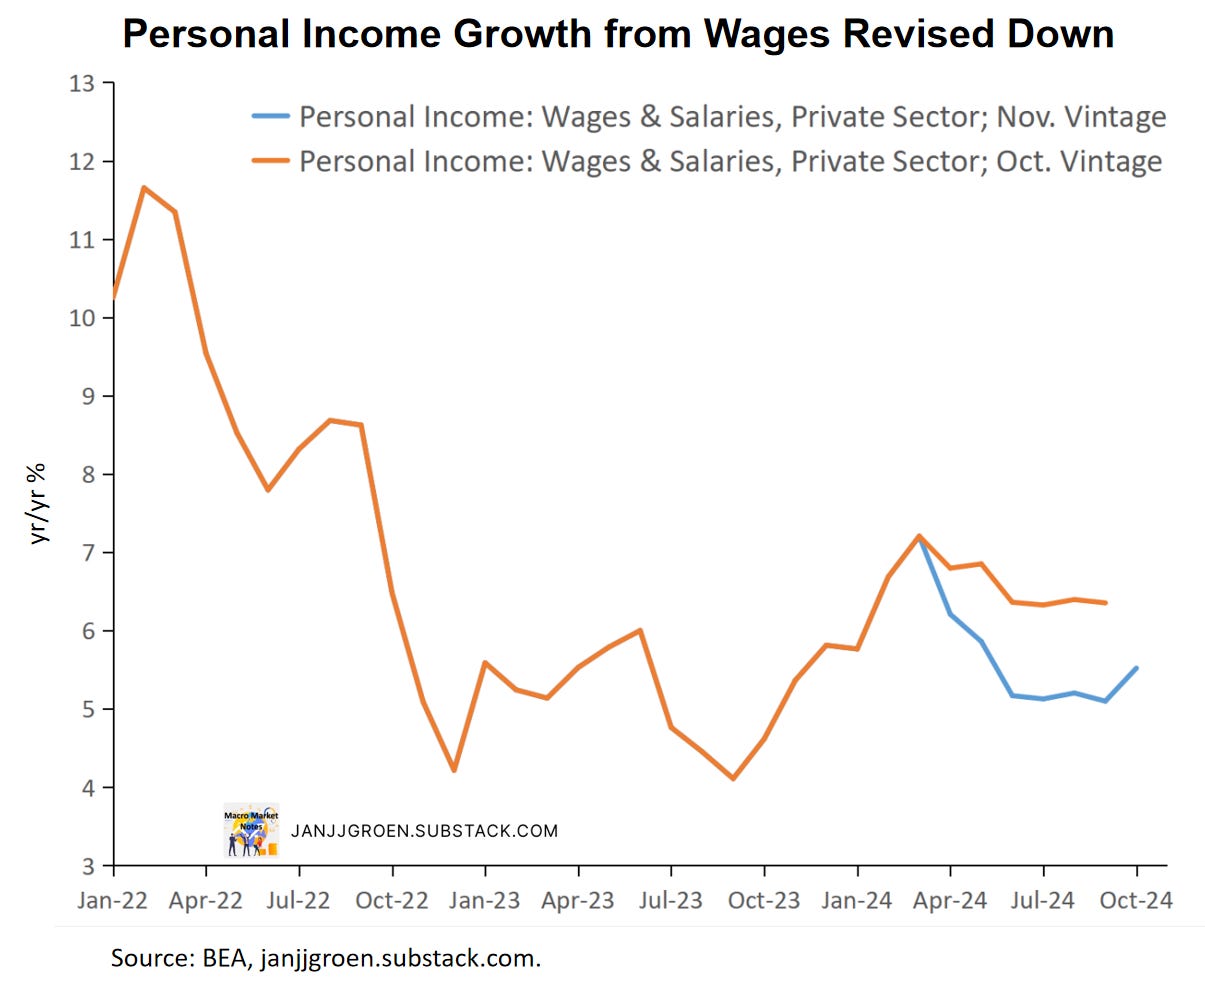
The year/year wage income growth rate in October equaled 5.5%, up from September’s 5.1% (revised down from 6.4% previously - chart above). Despite the downward revisions to the path of wage income growth going back to April, October’s growth rate is well above the rate observed in October 2023.
To interpret wage income growth trends, I earlier proposed to compare wage income growth with a neutral benchmark growth rate based on trend non-farm business sector (NFB) output growth and either the abovementioned common inflation expectations factor or the 2% Fed inflation target. Similar to what I did when discussing wages and inflation expectations in my October 2023 update, I now also incorporate trend labor share growth into this neutral benchmark.
Any deviation in actual household wage income growth above or below the aforementioned inflation target-consistent neutral benchmark means household wage income growth outpaces or cannot sustain in the medium term the 2% inflation target.
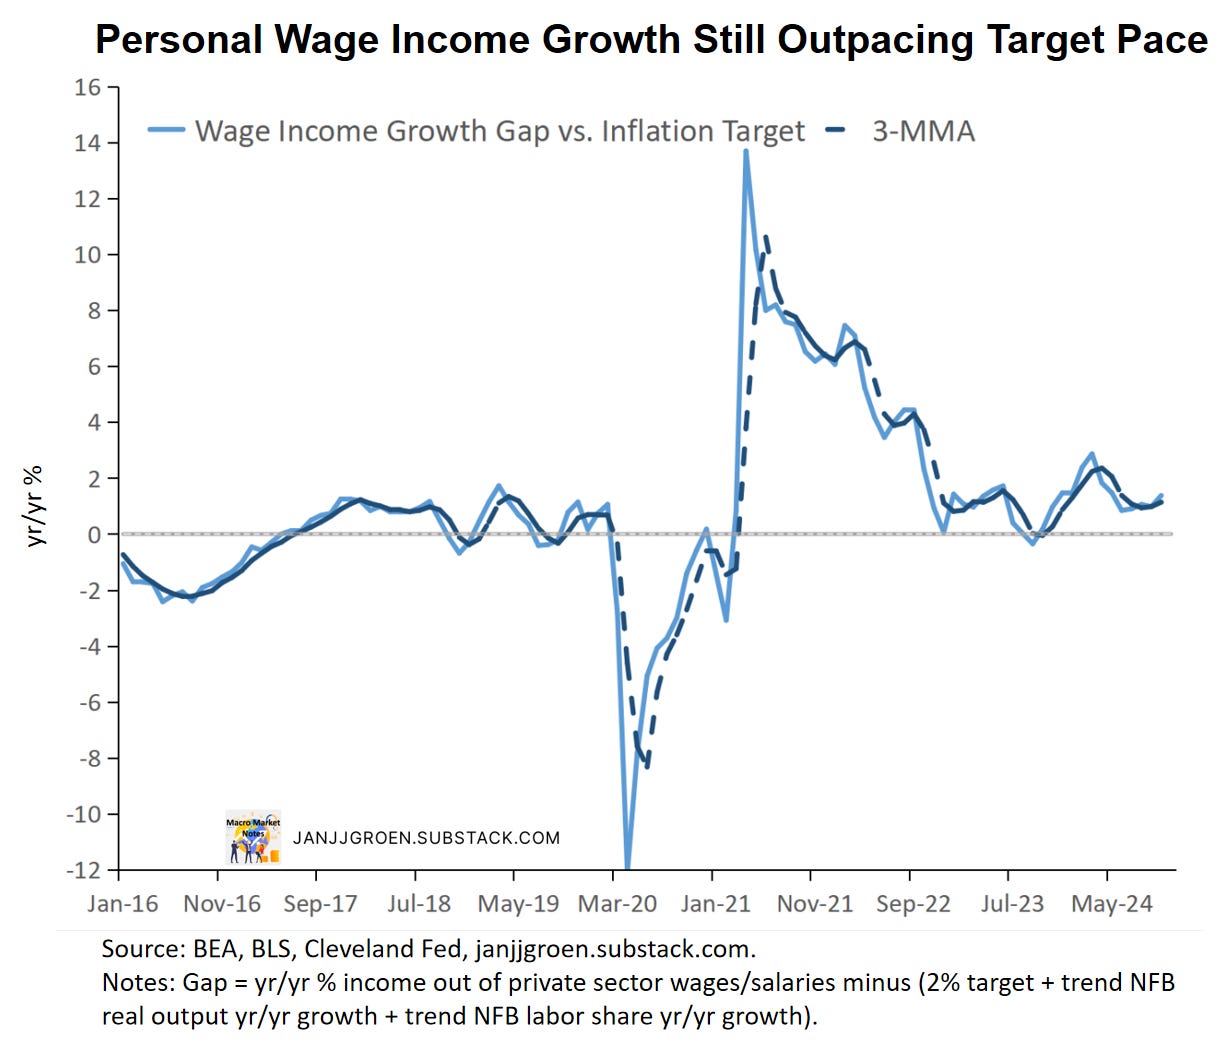
The chart above shows that there continues to be a notable wage income growth gap vs the 2% inflation target pace. The aforementioned downward revisions of recent wage income growth meant that the extent of the overshoot was revised down as well, from an overshoot in a +2.5 to +3 percentage point range in the September report to a +0.8 to +1.4 percentage point overshoot since June in the current release. So, household income growth out of wages is currently easily more in line with about 3% PCE inflation than with the Fed’s 2% target.
With nominal wage income growth thus continuing to overshoot the pace consistent with the target in the medium term, household spending growth remains a potential impediment to a sustainable return of inflation to 2%.
Households Excess Savings Gradually Lower
Household spending was up 0.3% over the month in October, with disposable household income growing a sizeable 0.7% for the same period. As a consequence, the savings rate increased to 4.4% in October compared to 4.1% previously (downwardly revised from 4.6%).
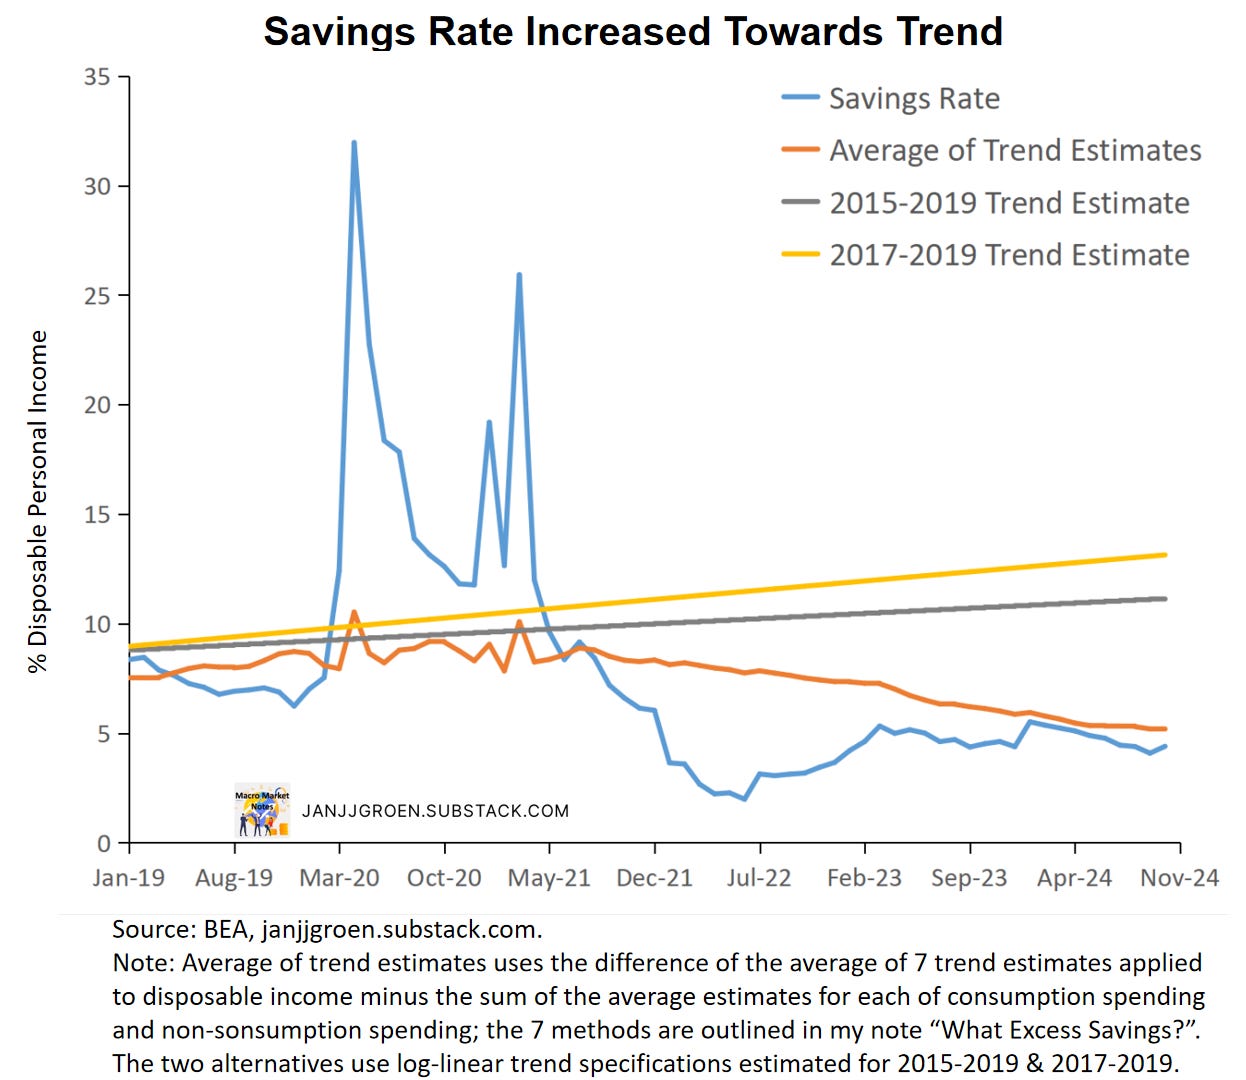
The chart above shows that over the month the savings rate moved back towards my trend savings rate estimate of 5.2% in October using the ‘average of trend’ approach outlined in my earlier excess savings note (orange line). This trend savings rate estimate remained broadly unchanged compared to September, which was revised down relative to last month given the above discussed wage income downgrades. Both the actual and my trend savings rates remain below trend savings rate assumptions used elsewhere (grey and yellow lines).

Above-trend growth in disposable income continues to be a partial offset to the drawdowns in excess savings coming from above-trend growth in consumption spending and interest payments (green bars vs orange + blue bars in above chart). Consequently, in October cumulative excess savings declined from $433 billion in the previous month (revised up from $426 billion) to about $419 billion (see chart above).
Underlying Consumption Growth Remains Solid
As is the case with headline inflation, headline real consumption spending growth often is driven by volatile components that not always reflect the underlying strength of the economy. A core real consumption spending growth measure, therefore, would be really useful, and I do that by approximating such a core measure based on the weighted median across 177 components1 of headline real personal consumption expenditures (PCE). More specifically, the core, or underlying, consumption growth measure equals the growth rate of the real PCE component at the 50% percentile across growth rates of these 177 sub-components of headline real PCE.

The chart above focuses on three-month annualized consumption growth rates. Headline consumption growth has been overshooting the underlying rate since Q1 2024 although the pace back closer towards the median consumption growth pace in October. In September and October, the median three-month growth pace stabilized at a respectable 2.3% (September revised up from 2.2% previously). As the chart above indicates that headline consumption tends to realign with the median pace when large discrepancies arise, it should do so towards a still very solid pace.

When I compare headline and underlying consumption growth rates on a six-month basis in the chart above, it confirms that the uptick in the three-month median growth rate is likely to persist over the near-term and not ease back. Making the earlier mentioned 2.3% pace a very solid target pace for headline spending to converge back towards.
A large downshift in consumption is not expected over the next six months, as support from strong wage income growth rates, still healthy balance sheets and unspent accumulated excess pandemic savings has pushed up underlying consumption growth as well.
Underlying Inflation Rates Picking Up Momentum
In terms of inflation, core PCE inflation accelerated somewhat in October to about a 3.3% annualized monthly rate from 3.2% in September (upwardly revised from 3.1%). Core goods inflation did ease over the month but remained positive at +0.1% annualized month/month, down from +1.3% in September (unrevised), whereas core service inflation picked up the pace notably to 4.4% annualized month/month in October from an upwardly revised 3.8% in the preceding month.
The Fed’s favorite gauge of underlying inflation, core services excl. housing PCE inflation, also accelerated from (an upwardly revised) 3.8% annualized month/month in September to about 4.4%. Given the large volatility in this measure since the pandemic it seems worthwhile to smooth through noisy month-over-month dynamics.

The chart above plots three-, six- and 12-month annualized inflation rates for the non-housing core services PCE deflator. The average annualized monthly rate still reads about 4% for the post-COVID era (black dashed line), two times the average rate we observed for the immediate years pre-COVID.
The momentum measures in the chart above have been sticky around 4% for most of 2023. Since April of this year, momentum in this non-housing core services inflation measure slowed again and this slowing became more pronounced over the past couple of months. However, the three-month inflation rate has been accelerating since August, and now last month the six- and twelve-month rates picked up the pace as well. This could mean we have bottomed, and that the recent disinflationary momentum might is behind us.
Instead of focusing on whether specific components of inflation should be ignored or not when assessing underlying inflation trends, one could focus on the central tendency of consumer price inflation, a.k.a. the center of the distribution of all price changes unaffected by extremely volatile consumer price components. This could potentially provide a better sense of the target toward which inflation moves over time once those excessively volatile price changes have stabilized.
Such measures of central tendency for the PCE price indices use a variety of trimming procedures to weed out excessive volatile components of these price indices in a given month2:
Median CPI, which takes the inflation rate of the component at the 50% percentile of the CPI component price changes.
Trimmed Mean PCE (Dallas Fed), where the highest 31% and lowest 24% of PCE component price changes are dropped.
15% Trimmed Mean PCE, where the highest 7.5% and lowest 7.5% of PCE component price changes are dropped.
20% Trimmed Mean PCE, where the highest 10% and lowest 10% of PCE component price changes are dropped.
30% Trimmed Mean PCE, where the highest 15% and lowest 15% of PCE component price changes are dropped.
To get a sense of near-term trends in underlying PCE inflation I look at six-month averages of the annualized percentage point deviation of the above monthly central tendency inflation measures relative to their values as implied by 2% core PCE inflation. This is also consistent with public statements by Fed officials that they’d like to see sustained progress of inflation converging back to target, as measured over months and quarters of inflation progress.

For the most part six-month average deviations of underlying PCE inflation rates relative to the inflation target in the chart above have been around the Fed’s inflation target over the past two months. Going forward, however, it is not clear whether this will be sustainable.

The chart above looks at three-month average deviations across the underlying PCE inflation measures. Some measures (especially the 10%, 15% and 20% trimmed means) already started to firm back in August and by September this trend had broadened out across all measures. And while quantitatively the size of the overshoot relative to target is still contained, it does signal broad-based support for the earlier discussed pick-up in core PCE inflation.

Over a somewhat longer horizon of a year the underlying trends seems to indicate stabilization at rates above the 2% inflation target. The 12-month average deviations of underlying PCE inflation rates relative to the inflation target in the chart have over the past two months stabilized in the 2.5%-2.6% range, signaling that a potential return to target will likely not happen until well into 2025, if at all.
With underlying spending growth remaining solid, a pace of wage income growth well above the pace consistent with the inflation target, and a clear uptick in underlying inflation momentum, it suggests we are close to a turning point in the dynamics of inflation. Given where underlying inflation was over the past six months, the Fed will likely cut rates again in December, but it’ll be very cautious easing rates further in 2025.
For a description of these 177 components, see Appendix A in the Dallas Fed trimmed mean PCE inflation working paper, where I use the corresponding real quantities instead of the price indices.
The trimming is based on the inflation rates of 177 components of the PCE deflator, see Appendix A in the Dallas Fed trimmed mean PCE inflation working paper,