


Jan CPI & Retail Sales and Jobless Claims Trends
January core inflation and trimmed means came in strong. Real retail sales slowed in January as auto sales contracted. Despite low initial claims, there are signs of labor market weakening.

This post reviews trends from the most notable data releases this week: the January CPI and retail sales reports. In addition, I look at recent trends in jobless claims.
Key takeaways:
Core CPI inflation accelerated in January and trimmed mean CPI measures suggest that in terms of underlying PCE inflation disinflationary trends have bottomed out and possibly reversed.
Inflation-adjusted retail sales were weak in January both for real core goods with and without motor vehicles sales. Motor vehicle sales, possibly owing to trade policy uncertainty, have been the main driver behind real goods spending since August. Inflation-adjusted bar/restaurant spending, in contrast, remained solid and accelerated in January.
Initial jobless claims into February remained essentially unchanged at relatively low levels. Despite these low levels, historically low net hiring and strong population growth recently meant that initial claims might not have been low enough with some underlying weakness in the labor market building up since January.
The recent data suggest the Fed will remain on hold for a while given the underlying inflation trend.
January CPI: Lots of Red Flags
The topline January CPI numbers came in stronger than expected: Headline CPI rose 0.5% m/m (forecast: 0.3%) after December’s 0.4% gain. Core CPI increased 0.4% m/m (+0.446% vs. +0.210% in December, revised due to updated seasonal factors), beating the 0.3% forecast. Meanwhile, CPI Rent of Shelter (OER+Rent) inflation also rose from +0.3% to +0.4% m/m.
To get a feel of real underlying CPI inflation, one can look at the Cleveland Fed's trimmed mean CPI measures, which cast away excess volatile elements by either taking the median (price change of the CPI component at the 50th percentile across all price changes) or a 16% trimmed mean (weighted average of price changes once both the top 8th percentile and lowest 8th percentile of price changes are deleted). The Cleveland Fed’s trimmed mean measures, like core CPI, also signaled higher and, sticky, inflation. Median CPI inflation accelerated to +0.32% from +0.27% m/m, while the 16% Trimmed Mean CPI jumped to +0.42% from +0.25%.

This suggests a broad-based inflation acceleration and indeed when looking at non-housing CPI components the monthly increases were relatively steep as well, with non-medical insurance, travel services, and durables inflation all up. The latter jumped from -0.14% to +0.37% m/m—beyond typical start-of-year price effects, which really have been absent for this CPI component (see chart above - red circles are for Jan-Feb over the last three years).

Heightened tariff uncertainty is often assumed to encourage firms to front-load investment spending. Similarly, consumers might well have been accelerating durable goods purchases (e.g., cars, appliances) in anticipation of higher future costs (I noted this in the context of the December PCE report). The chart above suggests that such a shift has reversed durables CPI’s decline since mid-2022, coinciding with increased trade policy uncertainty since the election. This may well be due to firms in the affected sectors that now have greater pricing power because of this change in spending behavior, contributing to broad-based inflation.
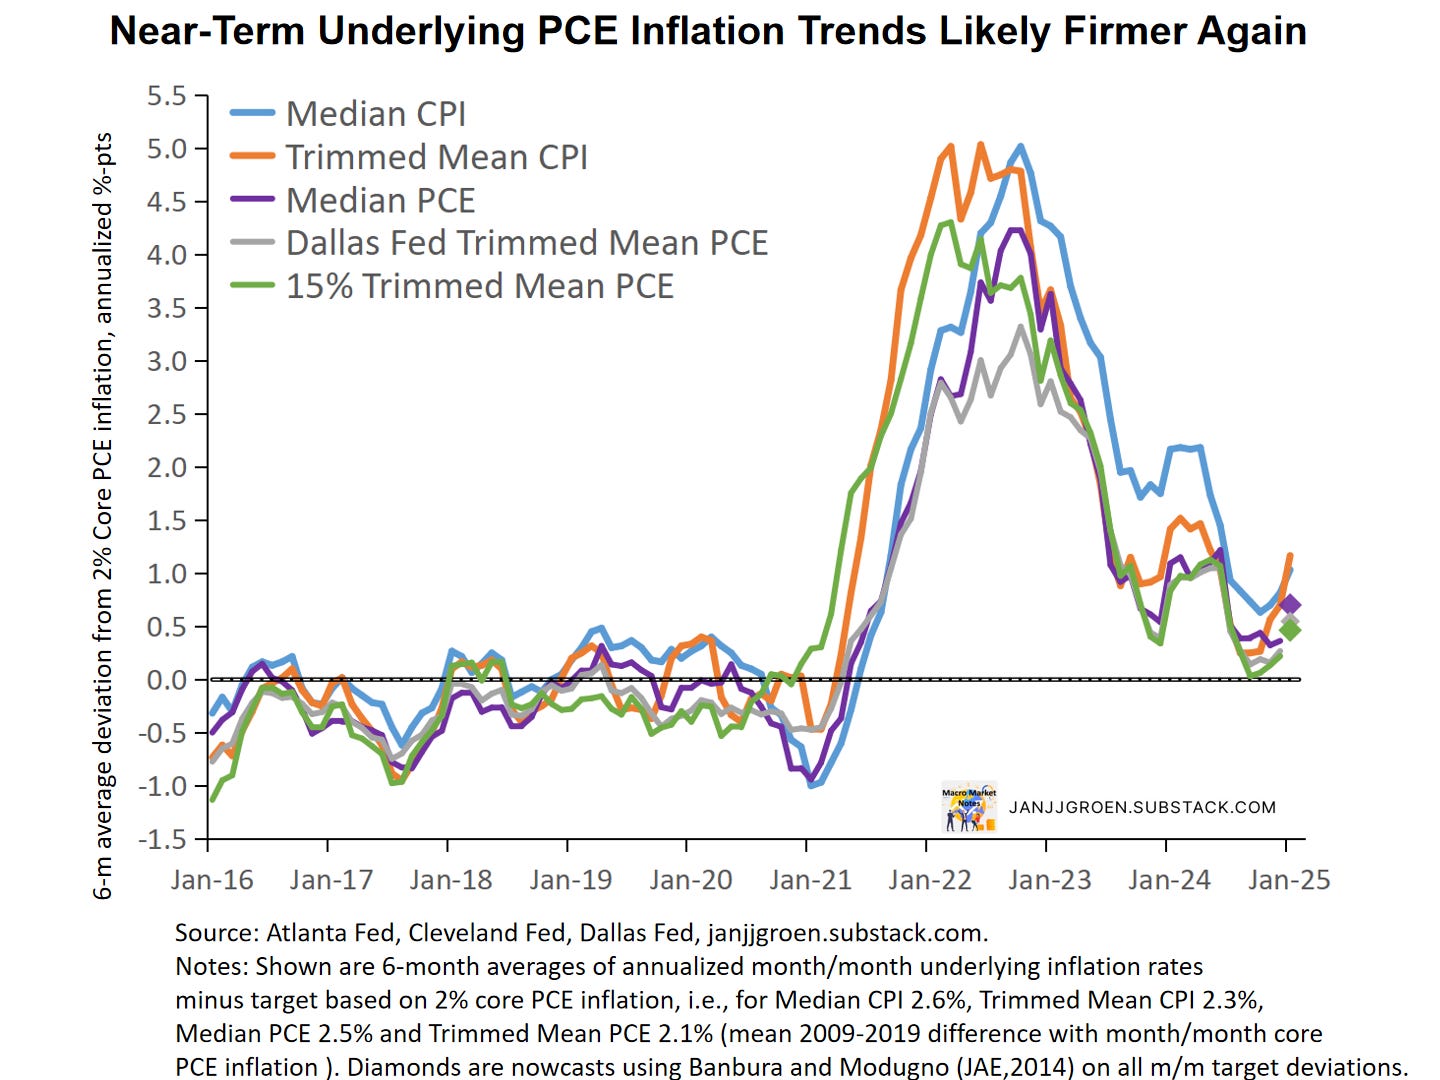
Both the Median CPI and 16% Trimmed Mean CPI inflation rates in the chart above are overshooting the Fed's 2% inflation target over a six-month period (at 3% and 3.2% in core PCE terms, resp.). Furthermore, both 6-month average measures increased over the month and thus moved further above the target.
When using the strong correlation between the CPI and PCE trimmed mean inflation series, statistical nowcasts of Median and Trimmed Mean PCE inflation rates (due later this month) suggest that these metrics will likely hit 2.5%+ on a six-month average basis in January, reinforcing that disinflation has not only stalled but is reversing (diamonds in the chart above). Coupled with a solid January jobs report, this strengthens the case for the Fed to stay on hold longer and take an even more cautious stance on rate cuts in 2025.
January Retail Sales: Weaker But Not All Gloom & Doom
Retail trade (i.e. retail sales pertaining to goods) contracted 1.2% over the month in January, after it increased 0.8% month/month in December. As always, it's crucial to remember to not take these figures at face value without looking under the hood:
Retail sales measures spending on goods as well as bar/restaurants spending. Thus, it really mostly measures goods consumption which is a relatively small slice of the monthly consumption basket, as about 2/3 of U.S. consumption expenditures relates to services.
Retail sales data does not correct for changes in prices, which for goods in particular can make a big impact: core goods prices in the December CPI report went up 0.28% month/month. As such stronger retail sales growth, for example, could merely reflect more the pace of price increases while retail sales volumes were less benign.
Deflating retail sales with CPI or core CPI overlooks the predominantly goods-focused nature of retail spending.
Dissecting retail trade data into subcomponents and aligning them with corresponding CPI subcomponents provides a more accurate assessment. Firstly, when it comes to retail trade data (that is, retail sales minus nominal bar and restaurant spending) I use the CPI Commodities, CPI Gasoline, CPI New & Used Vehicles and CPI Motor Vehicle Parts & Equipment indices to inflation adjust over retail trade as well as components related to sales at gasoline stations and motor vehicle dealers & parts. In case of bar and restaurant spending I deflate that component by means of the CPI Food Away from Home index.
Furthermore, I apply chain-weighting based on the Fisher index approach using current period and previous period prices and quantities of retail trade and the gas and motor vehicle components to parse out the impact of the latter two volatile components. This approach allows for time-varying weights, as prices and quantities change from period to period and consumers substitute between the different spending categories. It is the same methodology used by the BEA to compute real consumption and GDP.

Core goods spending declined in inflation-adjusted terms on a three-month basis, the first decline on a three-month basis since January 2024, as is evident from the chart above. Real core goods spending excluding motor vehicles, however, have been contracting on a three-month basis since November and this was somewhat less bad in January than in December (orange line in the chart above). After upward revisions to the November and December, inflation-adjusted bar and restaurant spending have been growing around 2.7% three-month AR in December and January, and while this was slower than in October and November households continued to spend at a healthy pace in bars and restaurants (purple line in the chart above).

The chart above indicates that while the three-month growth pace of inflation-adjusted core goods spending excl. motor vehicles has been weak since the fall, on a monthly basis real goods spending excl. gas and motor vehicles recovered in December and January to +4.4% and +3.4% AR respectively (orange line). Comparing this spending rate with over real core goods spending (blue vs orange lines) suggests that strong inflation-adjusted motor vehicles spending was the main driver of still strong real core goods spending in Q4, and that same category pulled back severely in January (real motor vehicle sales were +8.3% month/month AR in December vs -38% in January).
In terms of inflation-adjusted bar and restaurant spending, this recovered notably in January after a weak December (purple line in the above chart): +8% month/month AR vs -2.6%. This dynamic seems somewhat at odds with lower reading from consumer sentiment surveys in January that reflected increased policy uncertainty owing to possible policy actions of the incoming Trump 2.0 administration. For Q1 consumption spending, the outlook for goods just became a bit dire, as tariff uncertainty is making these items, especially durable goods, more expensive, and services spending might still remain solid.
This Week’s Initial Jobless Claims Trends
Initial claims for the week ending February 8th decreased slightly by 7000 persons compared to the preceding week and stood at 213,000 persons.

When I focus on non-seasonally adjusted data and compare today’s data with data from previous years in the same week it suggests initial claims recently have in line with the typical dynamic of this time of the year (chart above).
In terms of the unemployment outlook, initial claims are usually considered as a high frequency, real-time indicator of layoffs. What is relevant in that context is whether the layoff rate as implied by initial claims is significantly high or low to put substantial upward or downward pressure on the unemployment rate. To assess this, I laid out earlier a methodology to determine a benchmark rate for initial claims for the current month that equals the maximum number of initial claimants that will keep the unemployment rate constant relative to the previous month. If current initial claims rise above this claims benchmark rate, initial claims could potentially start to add to the unemployment rate.

The chart above compares (seasonally adjusted) initial jobless claims and its four-week moving average with the claims benchmark rate based entirely on BLS data (orange line) as well as a claims benchmark rate that instead incorporates the CBO’s more aggressive population projections for 2020-2024 (purple line). This CBO population projection reflects the 2025 update published on January 13, which incorporates stronger net immigration estimates than the Census estimates used by the BLS, at least until the current year. The more aggressive population growth projections clearly have lowered the benchmark rate for claims in 2023 and 2024 (orange vs purple lines in the above chart).
These benchmarks also incorporate the latest JOLTS data on hiring, quits and retirements, with the resulting net hirings dropping to historically low levels. Combined with the relatively high breakeven jobs growth rate based higher CBO population projections in the purple benchmark line this suggests that layoffs really need to remain very low for the labor market not to deteriorate meaningfully. So, although initial claims have been low comparing this may not have been that low given weak hiring and strong population growth rates, as they are currently running slightly higher than the rate that would keep unemployment stable at 4% (blue & gray lines vs the purple line).
While underlying trends in the January CPI report suggest disinflation has stalled and trade policy uncertainty resulting in strong durable price inflation, this might have adversely impacted household goods spending going into 2025 with some recent build up in underlying labor market weakness exacerbating this dynamic somewhat. The Fed will remain cautious about further cuts (if any) in 2025, especially given the uncertainty about tariffs, but will take note of the recent weaker goods spending data.