


Jan. Payrolls: An Encouraging Start
January payrolls growth slowed but so did the unemployment rate, due to an improving job-finding rate. Wage growth accelerated.

Today’s release of the January Employment Situation report was, as usual at this time of the year, impacted by the annual benchmark revisions and population control for both labor market surveys. Looking through these, recent payrolls growth trends recovered recently, and the unemployment rate eased further owing to a recovery in job-finding probabilities for an unemployed person. Wage growth, however, accelerated compared to trends.
Key takeaways:
Payrolls growth slowed in January, but near-term trends increased above the breakeven pace needed to keep the unemployment rate constant at current levels based on higher population projections.
The unemployment rate decreased to 4% as the labor force participation rate increased to 62.6%.
The job-finding rate improved over the month to 49% with smoothed trends at around 47%. The unemployment rate consistent with recent job-separation and job-finding rates increased but remains relatively low; smoothed trends suggest that in the near term the unemployment rate will likely stabilize around 4.1%.
Wage growth in composition-adjusted average hourly earnings remains elevated at paces inconsistent with both the 2% inflation target and near-term inflation expectations.
Today’s data means there’s no urgent need for the Fed to change its policy rate over the coming months.
January Jobs Growth: Easing but Solid
The January jobs report released today indicated that payrolls in the establishment survey grew less than the consensus expectation as they were up by 143,000 persons in December, compared to a 307,000 increase in the preceding month (which was revised up from 256,000 initially). Payrolls growth for November and December combined were revised up by 100,000 persons.
Part of the large revision came on the back of the annual benchmark revision. Back in August the release of the Preliminary Benchmark revision suggested a potential total revision of the payrolls level in March 2024 of -818,000. In this report the final benchmark revision indicated that this downward revision was less steep at -589,000 on a seasonally adjusted basis. The chart below shows that the benchmark revision led to payrolls growth in H2 2023 and Q1 2024 that was slower than initially reported (solid blue vs dashed purple lines).

The unemployment rate ticked down 10bps to 4% in January. In three-digit terms the unemployment rate eased from 4.086% in December to 4.011%. The population control in the household survey was revised up in this report to bring the working population estimate in January 2025 more in line with other with other projections like those of the CBO: 272.7 million people vs. 273 million in the most recent CBO projection. This is a one revision that will not be applied to past data. Correcting for this population control meant that without it the unemployment rate would have dropped by 20bps to 3.9%.
The population control did impact in particular the level variables in the household survey. Household employment grew in January by a significant 2.23 million people but without the annual working population update this would have been +234,000 persons, which is still very solid (orange line vs orange dot in the chart above). The labor force participation rate ticked up 10bps to 62.6%, which was unaffected by the annual working population adjustment.
Underlying Labor Market Trends

Moving beyond the month-to-month movements, the chart above shows three-month moving averages of payrolls changes from the establishment survey since February 2022, both pre-final benchmark revision as well as with this revision incorporated (blue solid vs blue dashed lines in the chart above). Unlike the pre-revision payrolls data, the revised data suggests that the smoothed trend in payrolls growth appear to have reached a trough by September and recovered since throughout the fall into 2025. The revised data do show that when the smoothed trend reached its trough, it dropped below the breakeven pace needed to keep the unemployment rate constant in a given month based on Census-based BLS population numbers (purple line in the above chart).
Note that the estimate of the breakeven pace that keeps the unemployment rate constant in a given month is conditional on the BLS’ population growth estimates as well as the labor force participation rate in that month. Although for this year the BLS incorporated a higher working population estimate, this did not affect the pre-2025 data.
The chart above therefore also includes an adjusted breakeven payrolls growth pace for a constant unemployment rate, which adjusts the BLS’ population projections for 2020-2024 to bring them line with the CBO’s 2020-2024 noninstitutionalized population estimates (gray line in the chart above). By comparing the trends in (revised) payrolls to this adjusted breakeven pace it seems throughout most of 2024 payrolls growth fell short of keeping up with the higher CBO population growth projections. The CBO-implied breakeven pace needed to keep the unemployment rate at 4% is around 221,000 persons in January. It is therefore encouraging to see the revised three-month payrolls growth rate finally running above the 221,000 breakeven pace, suggesting diminishing upside risks to the unemployment rate in the near-term.
Additional details about the underlying strength of the labor market can be inferred from the household employment survey. Following Shimer (AER, 2005) and Shimer (RED, 2012), we can use data on total unemployed and employed persons as well as the number of people that are unemployed for less than 5 weeks to estimate:
Job-finding rate: the probability an unemployed person in month t will find a job or leaves the labor force. This is calculated assuming that total unemployment in month t+1 equals month t unemployment plus the number of people unemployed for less than 5 weeks in month t+1.1
Job-exit rate: the likelihood an employed person in month t will exit its job either due to layoffs, quits or retirement, which depends on data on the job-finding rate, unemployment and labor force.2
The chart above shows a plot for the estimated job-exit rate. This job-exit rate has been relatively stable over the past two years, with a moderate downward shift in the first half of 2023 that stabilized between June and October but then rose again until this summer. Note, however, that the y-axis in the chart above also makes clear that the variability in the separation rate has been really modest.

The job-exit rate jumped up between June and August but has been decreasing notably between August and November (chart above). The odds of a job exit picked up slightly from November going into December and went up more between December and January despite relatively stable layoff and quits rates for December.

In 2023 the job-finding rate declined a lot after Q1 2023 (chart above) and this decline generally continued in 2024 to about 42% for October going into November, after which it recovered substantially in December. In January both the overall number of unemployed persons as well as the number of newly unemployed persons (less than 5 weeks in duration) declined over the month: -37,000 vs. +134,000. Given that overall unemployment declined in contrast to newly unemployment, the likelihood to exit unemployment between December and January improved again, with a job-finding rate equal to 49% for December going into January (chart above). Three- and six-month averaged job-finding rates for November into December settled at around 47%.
The above discussed annual population adjustment of the household survey also potentially could have an impact on the above job-findings rate estimates. As was the case with the unemployment rate, however, not applying the population control have made things seem even better, as the increased in newly unemployed would have been +100,000 instead of +134,000. Not applying the population control would have moved up the job-finding rate between December and January from 49% in the chart above to about 59%. Not allowing for a more realistic population estimate would have overstated the recovery in the job-finding rate.

As in Shimer (AER, 2005) we can combine the above discussed job-exit and job-finding rates to calculate a flow-consistent unemployment rate and the chart above plots both the corresponding monthly rate and the three-month average of this rate. The (three-month average) flow-consistent unemployment rate is the unemployment rate that prevails when the job-exit and job-finding rates remain constant at their current (three-month average) levels. Deviations compared to the official unemployment rate should dissipate over time and often leads changes in the official rate.
The chart above shows clearly that a stable job-exit rate and an improving job-finding rate led to a substantial drop in the monthly flow-consistent unemployment rate for November into December and then bounced back somewhat between December and January. The recent flow-consistent unemployment rates are the lowest since March.
Given the choppiness in this measure, it’s probably more useful to look at three-month averages. Throughout most of 2024 the flow-consistent unemployment rate on a three-month average basis had been outpacing the official unemployment rate and leading the rise in the latter (solid blue and orange lines in the chart above). This was largely driven by a deterioration in the job finding rate over that period, which reflected labor demand weakening. More recently, three-month averages of headline and flow-consistent unemployment rates suggest that over the near term the unemployment rate will likely stabilize around 4.1%.
Despite slower payrolls growth in January, when taking into account revisions to both labor market surveys, both smoothed payrolls growth trends and the job-finding rate show tentative signs that at the very least the labor market has stabilized and could very well expand at a higher pace again.
Wage Growth Accelerated
Average hourly earnings of all private sector employees grew significantly at 0.5% month/month in January, up from 0.3% in December, but eased somewhat in year/year terms from (an upwardly revised) 4.7% in December to 4%. For production and non-supervisory workers, hourly earnings also accelerated to 0.5% month/month in January, up from (an upwardly revised) 0.3% in the preceding month, and on a year/year basis growth decelerated from (an upwardly revised) 4.6% to 4.1% in January.
The wage data from the jobs report are notoriously noisy, given that they are revised often and do not correct for the sectoral and skills composition of jobs growth over the month. There are better quality wage data available, such as the Atlanta Fed Wage Growth Tracker and the Employment Cost Index, but the Atlanta Fed does construct a rudimentary composition correction for average hourly earnings from the jobs report, which can be found here.
When applying the Atlanta Fed composition correction on the monthly average hourly earnings for January, they went down from the official 0.5% to 0.4% (similar to the corrected 0.4% for preceding month), and for production and non-supervisory workers the correction kept the rate at the official 0.5% but pushed up the increase in the preceding month from 0.3% to 0.4%.
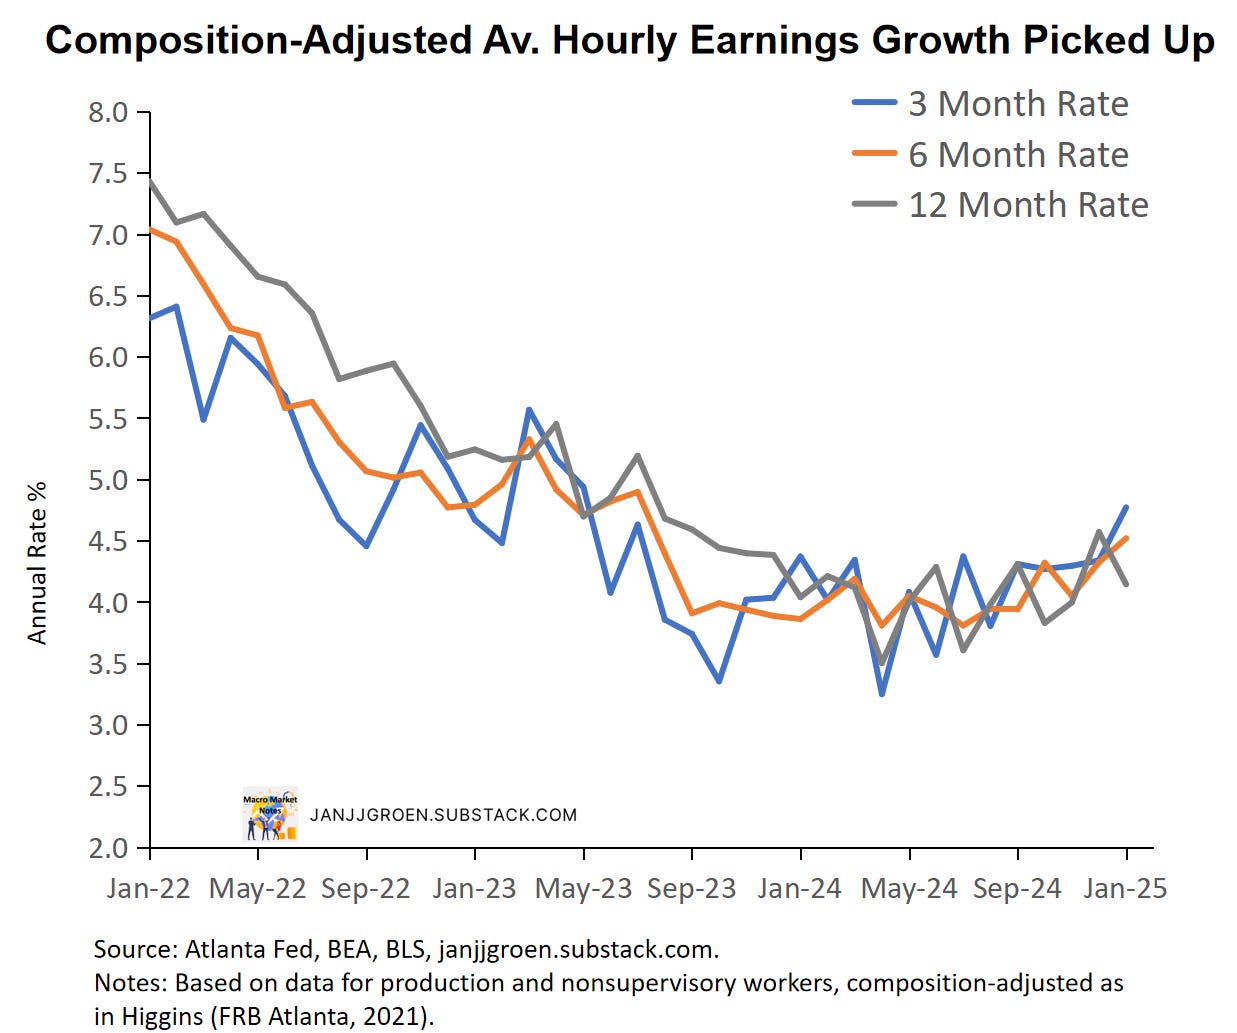
Consequently, we can observe from the chart above is that the three- and six-month wage growth rates accelerated since the fall. On a three-, six- and twelve-month basis composition-adjusted wage growth have running at or above 4% for most of 2024.
I can combine labor productivity and labor share trend estimates with the 2% inflation target, along the lines I have done in my “Wages and Inflation Expectations” notes and incorporating the 2024 Q4 update of productivity data to get a medium-run annual wage growth rate consistent with 2% inflation.
Additionally, instead of the 2% target one can use my “Main Street” year-ahead inflation expectations proxy, i.e., the common trend across survey-based near-term inflation expectations from firm and consumer surveys. After incorporating December and January updates for the survey data this trend in near-term inflation expectations picked up in January since Q4 2024 from around 2.5% to about 2.7% in year/year PCE inflation terms in January.
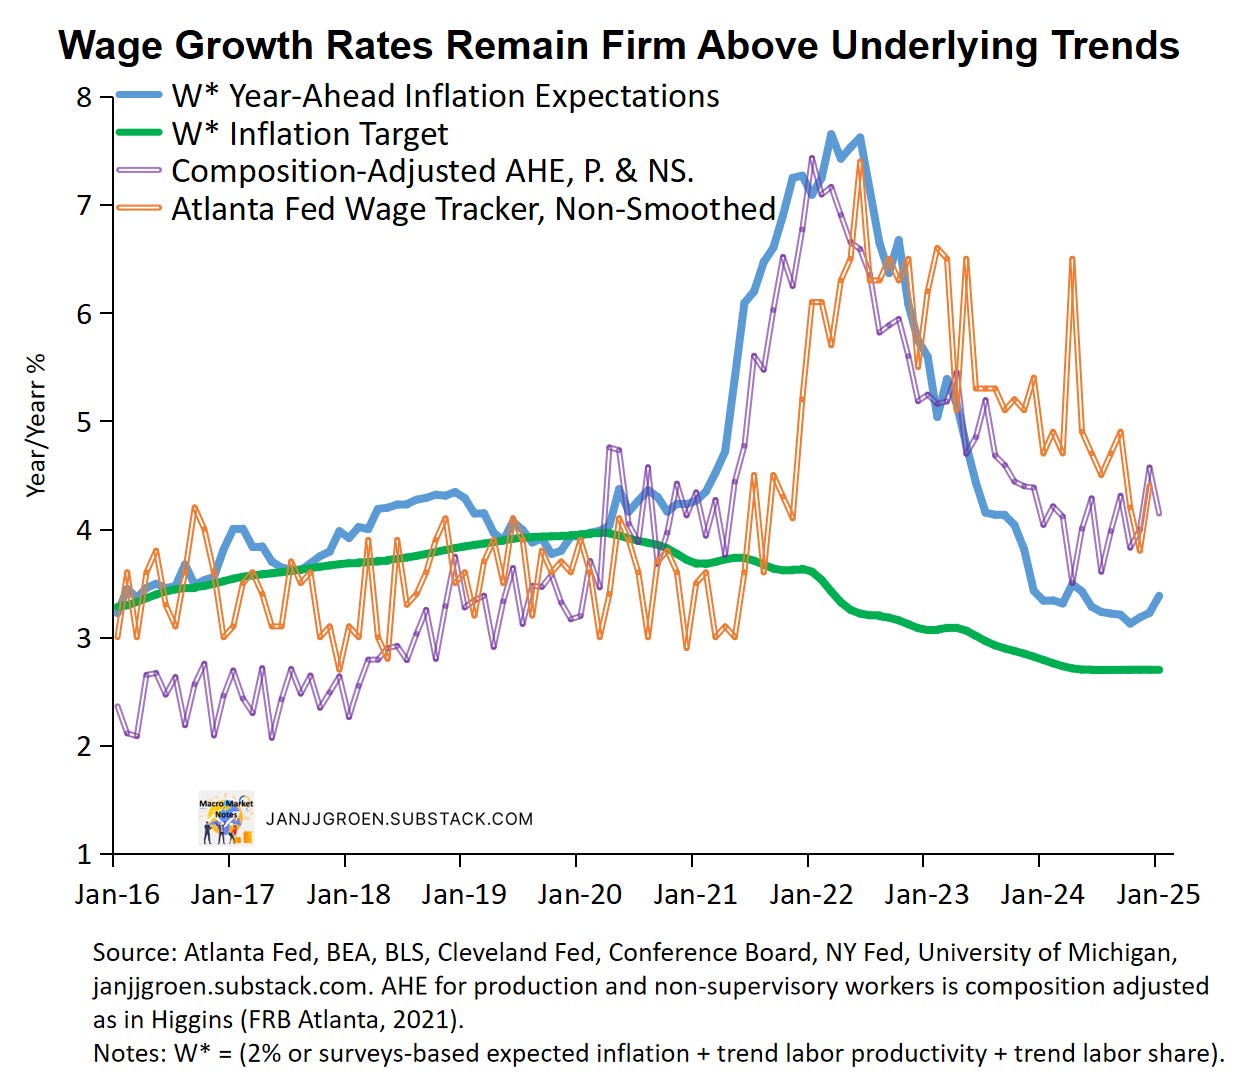
Compared to both the composition-adjusted AHE data for production and non-supervisory workers for January and the unsmoothed Atlanta Fed wage tracker into December, annual wage growth rates still outpace the 2.7% pace consistent with 2% PCE inflation in the medium term (green line in the above chart). In fact, wage growth also runs above the wage growth pace consistent with 2.7% PCE inflation implied by “Main Street” near-term inflation expectations (blue line in the chart above).
After the conclusion of the January FOMC meeting the Fed clearly signaled it is in no hurry to change policy rates any further given uncertainties regarding the inflation outlook as well as elevated policy uncertainty. Today’s January jobs report clearly showed a stabilized labor market (especially after taking into account annual revisions) and from that perspective there’s no urgent need to cut rates again any time soon. With wage growth momentum remaining stubbornly elevated as well as a pick-up in underlying inflation momentum and household spending growth the Fed is likely to stay on hold to, at least, the May FOMC meeting.
Given this calculation, the job-finding rate will run up to December utilizing data on (short-term) unemployment for January.
As the calculation of the job-separation rate depends also on (short-term) unemployment for January, we cannot go beyond December.