


Dec Personal Income & Outlays: Underlying Inflation Up
Near-term trends in underlying inflation are rising again with annual trends now increasing further above 2%. Consumption growth was strong but skewed.

The December Personal Income and Outlays report provides a good insight into the U.S. consumer as well as inflationary pressures going forward. This note presents some of these insights.
Key takeaways:
The central tendency measures of PCE inflation rose above 2% on a six-month basis. On a three-month basis these metrics were stable, but over an annual horizon most underlying inflation rates now increased up within the 2.5%-3% range.
Personal income growth out of wages and salaries rose at a steady, solid pace in December. Household wage income continues to grow faster than the pace that’s consistent with 2% PCE inflation over the medium-term.
The stock of excess savings has NOT run out and continues to be a tailwind for consumption. Between November and December, it fell around $20 billion and equaled about $456 billion in December.
Headline consumption growth was strong in December, well above its underlying spending growth pace. This suggests spending strength was concentrated in relatively few consumption categories; the threat of tariffs likely caused household to pull forward spending in those categories. The underlying pace of consumption spending itself declined in December, but its near-term trend remains solid. Consequently, the potential downshift in consumption over the near term will likely not be dramatic.
Consumption spending and wage income of households continue to show strong growth, with underlying inflation on an upward trajectory. The Fed will likely abstain from further rates cuts for quite a while.
Medium Term Underlying Inflation on the Rise Again
Core PCE inflation accelerated in December to about a 1.9% annualized monthly rate from 1.3% in November (downwardly revised from 1.4%). Core goods inflation turned more negative over the month at -2.9% annualized month/month, down from -0.8% in November (essentially unrevised). Core service inflation increased to 3.5% annualized month/month in December from a slightly downwardly revised 2% in the preceding month.
The Fed’s favorite gauge of underlying inflation, core services excl. housing PCE inflation, also accelerated, notably, from (a downwardly revised) 1.8% annualized month/month in November to about 3.4%. Given the large volatility in this measure since the pandemic it is better to smooth through noisy month-over-month dynamics.

The chart above plots three-, six- and 12-month annualized inflation rates for the non-housing core services PCE deflator. The average annualized monthly rate reads about 3.9% for the post-COVID era (black dashed line), almost two times the average rate we observed for the immediate years pre-COVID.
Momentum in this non-housing core services inflation measure initially picked up in the fall with currently the three-month inflation rate remaining essentially stable around 3.2%. Longer duration six- and twelve-month rates are either still picking up the pace or remained stable above pre-COVID levels. The disinflationary momentum has, for now, evaporated for this inflation measure.
Instead of focusing on whether specific components of inflation should be ignored or not when assessing underlying inflation trends, one could focus on the central tendency of consumer price inflation, a.k.a. the center of the distribution of all price changes unaffected by extremely volatile consumer price components. This could potentially provide a better sense of the target toward which inflation moves over time once those excessively volatile price changes have stabilized.
Such measures of central tendency for the PCE price indices use a variety of trimming procedures to weed out excessive volatile components of these price indices in a given month:
Median PCE, which takes the inflation rate of the component at the 50% percentile of the PCE component price changes.
Trimmed Mean PCE (Dallas Fed), where the highest 31% and lowest 24% of PCE component price changes are dropped.
15% Trimmed Mean PCE, where the highest 7.5% and lowest 7.5% of PCE component price changes are dropped.
20% Trimmed Mean PCE, where the highest 10% and lowest 10% of PCE component price changes are dropped.
30% Trimmed Mean PCE, where the highest 15% and lowest 15% of PCE component price changes are dropped.
To get a sense of near-term trends in underlying PCE inflation I look at six-month averages of the annualized percentage point deviation of the above monthly central tendency inflation measures relative to their values as implied by 2% core PCE inflation. This is also consistent with public statements by Fed officials that they’d like to see sustained progress of inflation converging back to target, as measured over months and quarters of inflation progress.

For most underlying PCE inflation rates six-month average deviations relative to the inflation target were at the Fed’s inflation target by September (chart above). Since then, these six-month measures have slowly, but steadily, been rising again. However, going forward, is this sustainable?

The chart above looks at three-month average deviations from 2% core PCE inflation across the underlying PCE inflation measures. Some measures (especially the 10%, 15% and 20% trimmed means) started to firm back in August and by September this trend had broadened out across all measures. Today’s report suggests that most recently these three-month averages have stabilized at an above inflation target pace. This suggests one should not expect near-term trends to come back towards the Fed’s inflation target anytime soon.

Over a somewhat longer horizon of a year the underlying inflation trends indicate that have started to rise again further above the 2% inflation target. The 12-month average deviations of underlying PCE inflation rates relative to the inflation target in the chart above were stable within the 2.5%-3% range earlier in the fall but have started increase again since October. Current levels in the above chart suggests a longer-term core PCE inflation trend of at least 2.6%. This does suggest that a potential return to the inflation target in 2025 has now definitely dropped off the radar and has become doubtful for 2026.
Wage Income Growth Remains Steady and Solid
There were no significant revisions to the recent path of household income out of wages and salaries in the November report. The year/year wage income growth rate in December equaled 5.6%, in line with November’s rate (downwardly revised from 5.7%).
To interpret wage income growth trends, I earlier proposed to compare wage income growth with a neutral benchmark growth rate based on trend non-farm business sector (NFB) output growth and either the abovementioned common inflation expectations factor or the 2% Fed inflation target. Similar to what I did when discussing wages and inflation expectations in my October 2023 update, I now also incorporate trend labor share growth into this neutral benchmark.
Any deviation in actual household wage income growth above or below the aforementioned inflation target-consistent neutral benchmark means household wage income growth outpaces or cannot sustain in the medium term the 2% inflation target.

The chart above shows that there continues to be a notable wage income growth gap vs the 2% inflation target pace. Using today’s data vintage, as of December household income out of private sector wages grew 1.6 percentage point faster than what would be consistent with 2% PCE inflation over the medium term, up from 0.9 percentage point in July.
With nominal wage income growth thus continuing to overshoot the pace consistent with the target in the medium term, household spending growth remains a potential impediment to a sustainable return of inflation to 2%.
Consumer spending was up 0.7% over the month in December, with disposable household income growing 0.4% for the same period. As a consequence, the savings rate decreased to 3.8% in December compared to 4.1% previously (downwardly revised from 4.4%).
Over the month the savings rate decreased below my trend savings rate estimate of 4.8% in December using the ‘average of trend’ approach outlined in my earlier excess savings note (orange line). This trend savings rate estimate decreased modestly compared to November (4.9%, downwardly revised from 5.1% previously).
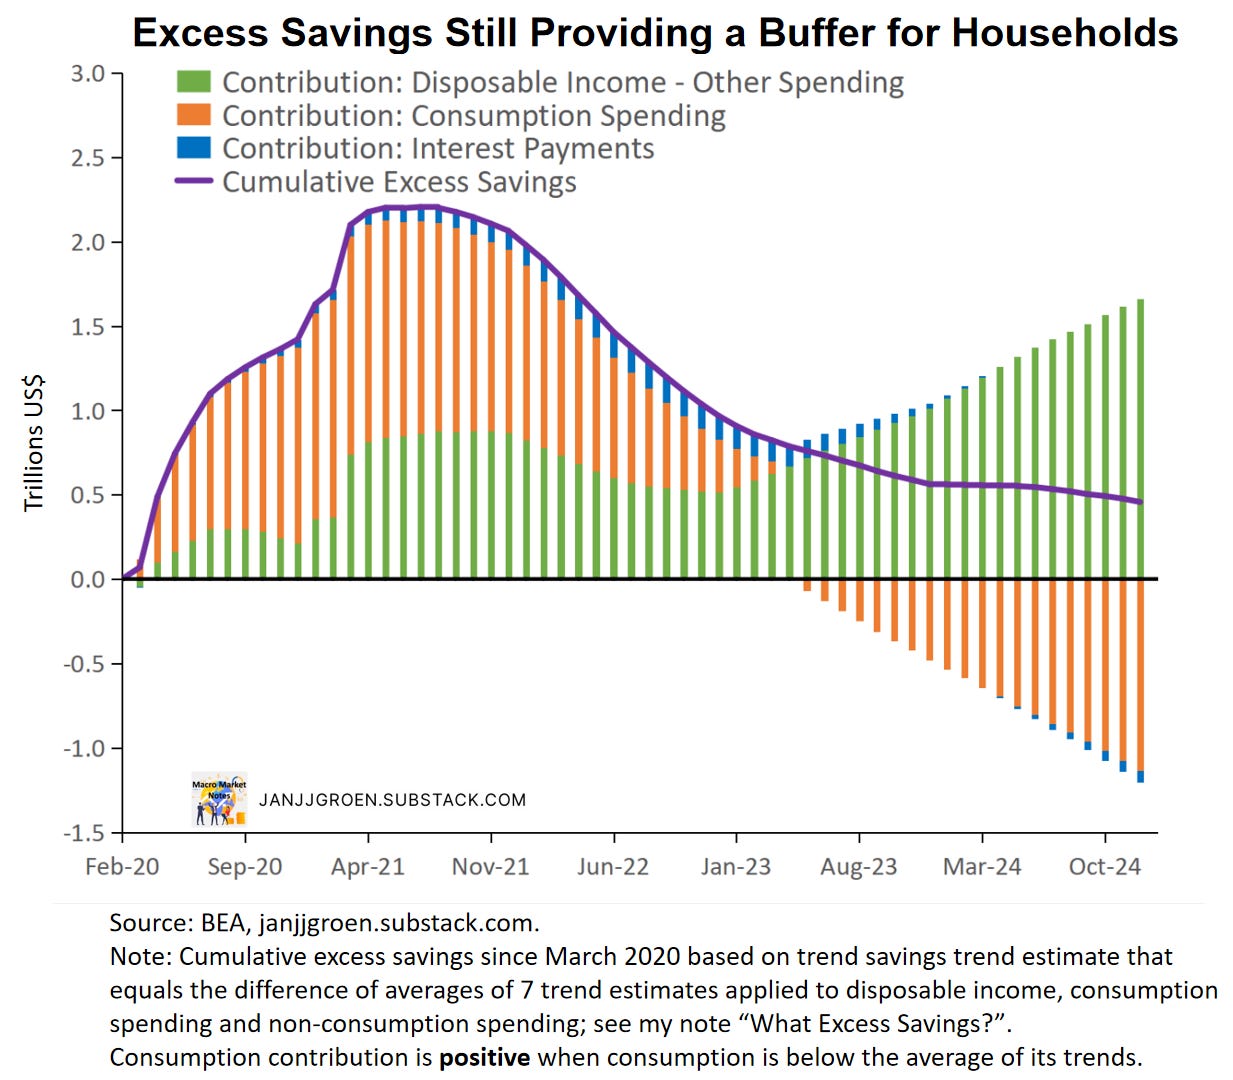
Using these estimate trend savings rates, the chart above shows that above-trend growth in disposable income continues to be a partial offset to the drawdowns in excess savings coming from above-trend growth in consumption spending and interest payments (green bars vs orange + blue bars). Consequently, in December cumulative excess savings declined from $475 billion in the previous month (revised up from $411 billion) to about $456 billion (see chart above). A lot of households (especially middle- and higher-income ones) continue to have access to a sizeable buffer to deal with shocks and higher-than-expected price increases.
Real Consumption Growth Remains Strong
As is the case with headline inflation, headline real consumption spending growth often is driven by volatile components that not always reflect the underlying strength of the economy. A core, or underlying, real consumption spending growth measure, therefore, would be really useful, and I do that by approximating such a core measure based on the weighted median across 177 components1 of headline real personal consumption expenditures (PCE). More specifically, the underlying consumption growth measure equals the growth rate of the real PCE component at the 50% percentile across growth rates of these 177 sub-components of headline real PCE.

The chart above focuses on three-month annualized consumption growth rates. Real consumption spending grew 4.4% in December, about as strong as in September (i.e. comparing Q4 with Q3) when it was 4.2%. However, when taking into account the corresponding median growth rate across the consumption categories, September’s consumption growth was well aligned with its median whereas in December it well overshot it, suggesting that strong December spending mainly was concentrated in a relatively few categories.

Strong consumption growth becoming more skewed over the final quarter of 2024 was also in line with inflation-adjusted sales growth from the December retail sales report, which indicated that real retails sales strength was mostly due to strong car sales. A likely cause of these recent spending trends is growing fears that forthcoming tariff hikes could make certain items notably more expensive. Indeed, a measure of trade policy uncertainty based on newspaper articles as put forward by Caldera et al. (JME, 2020) has risen sharply since last summer (chart above). And as a lot of these tariff threats have been aimed at Canada and Mexico, which are very embedded in the U.S. car production processes, so in particular car sales should have been impacted by rising trade policy uncertainty — the above chart indeed suggests that this was the case.

The discrepancy between headline and median consumption growth on a three-month basis, suggest any future correction could potentially temper consumption growth notably. However, the median growth rate can still be quite choppy on a three-month basis, so I compare headline and underlying consumption growth rates on a six-month basis in the chart above. On a six-month basis the median growth rate also eased somewhat in December but still hits 2.8%, very solid rate based over the past three years’ worth of data. This implies that headline spending growth pace is liable to ease over the near-term but still massively but a large downshift in consumption is not expected over the next six months. Strong wage income growth rates, still healthy balance sheets and unspent accumulated excess pandemic savings keep underlying consumption growth elevated.
Solid underlying spending growth and a pace of wage income growth well above the pace consistent with the inflation target imply that the demand side of the economy could potentially continue to pull inflation above target. Given the firming in underlying inflation rates the Fed will remain very cautious easing rates further in 2025, with increasing tail risk they will not move at all this year.
For a description of these 177 components, see Appendix A in the Dallas Fed trimmed mean PCE inflation working paper, where I use the corresponding real quantities instead of the price indices.