


Q4 2024 Productivity & Wages: The End of Tailwinds?
Labor productivity growth slowed towards trend, while the labor share grew at an above-trend pace. The latter has been the main driver of wage growth in 2024.

Today's release of the BLS's preliminary "Productivity and Costs" report for Q4 indicated a notable slowdown in the quarter/quarter labor productivity growth compared to Q3. Growth of the labor share, on the other hand, accelerated substantially on a quarterly basis after a decline in Q3. Medium-term trends in these series can be used to interpret recent wage growth, such as, for example, for the Fed’s favorite wage growth gauge, the private sector wage component of the Employment Cost Index (ECI), for Q4 that was released last week. This note looks at the above in a bit more detail.
Key takeaways:
Over the quarter labor productivity growth in Q4 eased and the year/year growth rate dropped from 2.1% to 1.6% in Q4, which is broadly in line with the pace of my estimate of trend labor productivity growth.
The labor share grew at substantially higher pace over the quarter and now outpaces its trend estimate, which is estimated to have declined 0.9% year/year in Q4. By comparison, my trend labor share estimate for 2018 was essentially stable around 61.5%.
The Q4 ECI index for wages (excl. incentive pay) of private sector workers went up 3.7% year/year. This is about 1 percentage point above the trend wage growth rate consistent with 2% PCE inflation given the trend growth rates of labor productivity and the labor share.
Throughout 2024 the overshoot in ECI wages of private sector workers was mainly driven by above trend year/year labor share growth: workers are increasingly getting a larger share of business revenues relative to longer term trends. Elevated near-term inflation expectations of firms and households contributed modestly to the overshoot as well.
As productivity growth slows towards trend growth, the favorable impact of temporarily elevated productivity growth on prices and wages rate is likely to fade in 2025. If above-trend growth in the workers’ share of business revenues persists, wage growth will remain above the 2% inflation pace in 2025.
Labor Productivity
Labor productivity for the non-farm business sector grew 1.2% quarter/quarter AR in Q4, after an upwardly revised 2.3% increase in Q3. On an annual basis labor productivity growth eased from 2.1% year/year to 1.6% in Q4. However, how does this compare to its underlying longer-term trend?
Without wanting to resort to some structural model, I base my estimate of trend productivity on a number of different purely statistical approaches as outlined here and use an average of the estimates from these approaches as the trend labor productivity estimate. As such this average reflects the uncertainty with respect to the 'true' trend level of labor productivity.

This estimate of trend labor productivity is plotted in year/year growth terms in the chart above (orange line). Trend labor productivity increased 1.6% year/year in Q4, pretty much in line with the average trend labor productivity growth rate in 2016-2019. So, no evidence of an acceleration in trend labor productivity growth as of yet, despite all the AI chatter in markets and the media.
Comparing actual labor productivity with my trend estimate suggests that after a long period of declines labor productivity turned a corner in Q1 2023 and started to converge back to trend. The above-trend labor productivity growth rates in 2023-2024 thus likely reflected a catch-up dynamic rather than accelerated trend labor productivity growth. Given that the productivity growth gap relative to trend seems to have closed, the favorable impact of temporarily elevated productivity growth on prices and wages rate is likely to fade in 2025.
The Labor Share
The labor share represents the compensation firms pay their workers as a share of the firms’ revenues. This measure is useful to have alongside labor productivity data, as higher labor productivity in principle should result in higher real wages but the extent to which this happens depends on this labor share.
In Q4 growth of the labor share for the non-farm business sector accelerated on a quarter/quarter basis, from -0.6% quarter/quarter AR to +1.2% in Q4. On an annual basis Q4 labor share growth was about +0.7% year/year vs. +0.3% in Q3. As was the case for labor productivity discussed earlier, I use an average across different purely statistical approaches (outlined here) to pin down the trend labor share.
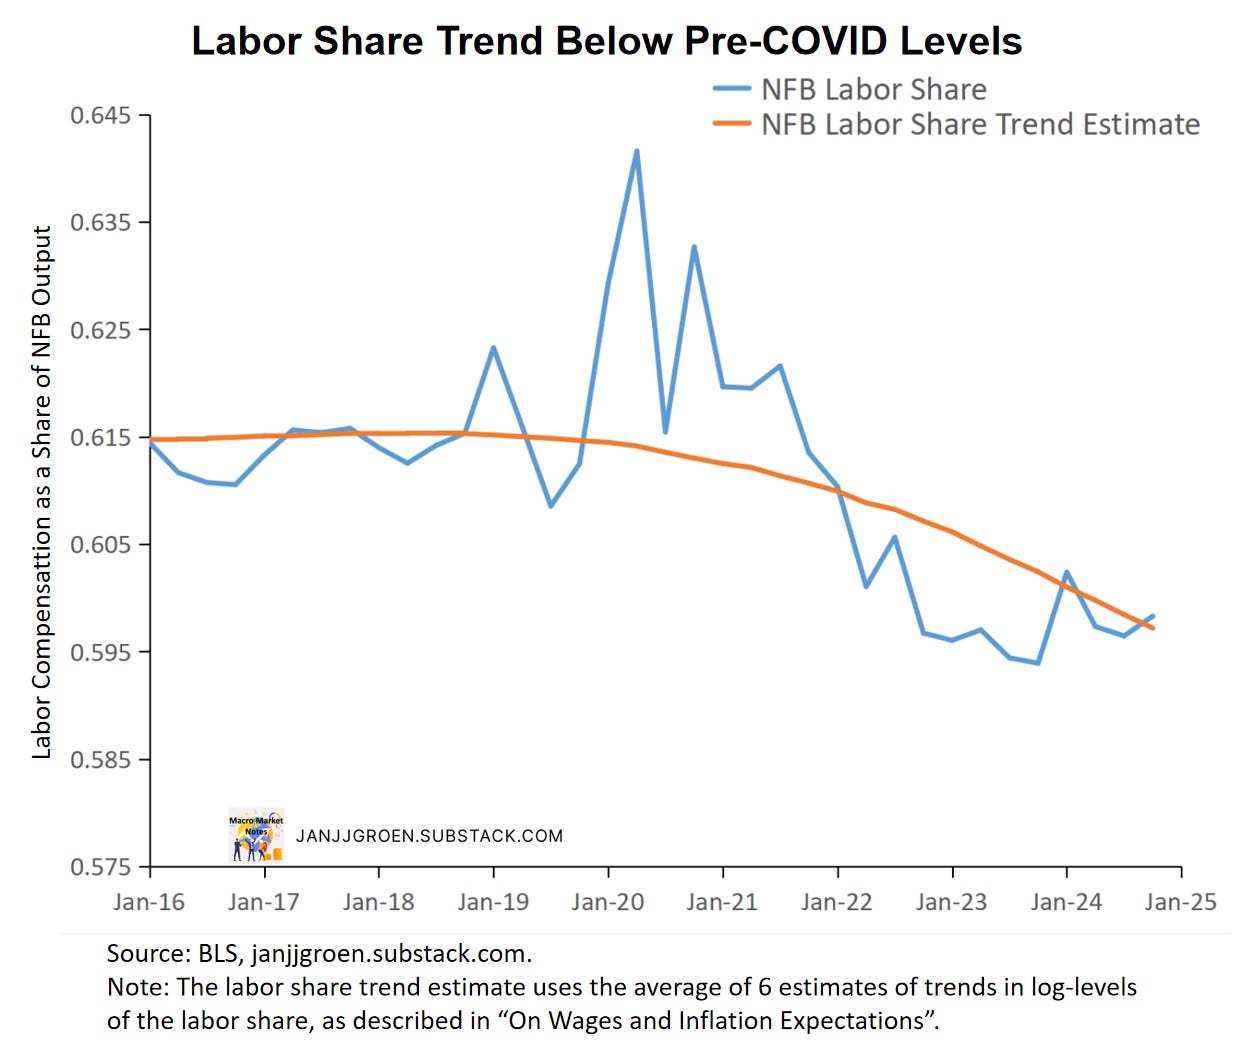
The orange line in the chart above depicts the trend component of the labor share. Throughout 2016-2018 this trend labor share was broadly stable around 61.5%, but it has been on a declining trajectory since 2019. Trend labor share growth in Q3 was about -0.9% year/year.
Q4 Wage Growth: Interpreting the Recent ECI Moves
The Employment Cost Index (ECI) is seen as the Fed’s favorite gauge of labor compensation growth, as it corrects for any compositional shifts across sectors (much like the Atlanta Fed Wage Growth Tracker). The Q4 ECI report was published on January 31st. The most important measure from this report is the ECI for wages of private sector workers (ECIWP), stripping out non-wage labor compensation (i.e., incentive pay) as well as public sector wages. ECIWP was up 3.7% year/year in Q4, comparable to 3.8% growth in Q3.
Much in the same way I do for monthly wage measures, one can use the trend estimates for labor productivity and the labor share outlined above to get a trend wage growth estimate consistent with the Fed’s 2% inflation target. This simply equates to 2% plus the year/year growth rates implied by the earlier discussed trend estimates of labor productivity and the labor share.
The chart above contrasts this trend wage growth measure with actual ECI wage growth, and recent wage growth remains this trend value. More specifically, for Q4 ECI wage growth equal to 3.7% year/year was about 1 percentage point above the rate of growth that would be consistent with 2% PCE inflation.
So, what drove the recent overshooting of wage growth compared to the pace consistent with 2% inflation? To do that I decompose the gap between actual ECI wage growth and its 2% inflation consistent trend using the deviations of actual year/year growth relative to estimated trend growth for both labor productivity and the labor share, the gap between year-ahead inflation expectations of firms and households (“Main Street”) compared to the 2% inflation target, and an unexplained residual.
The “Main Street” inflation expectations are extracted as the common trend across a number of surveys, as I described in an earlier post. After incorporating January and December updates of most firm and household surveys, these year-ahead “Main Street” expectations eased slightly in Q4 2024 to 2.47% in terms of year/year PCE inflation from 2.52% but picked up again to 2.65% in January - see my note here for more details.
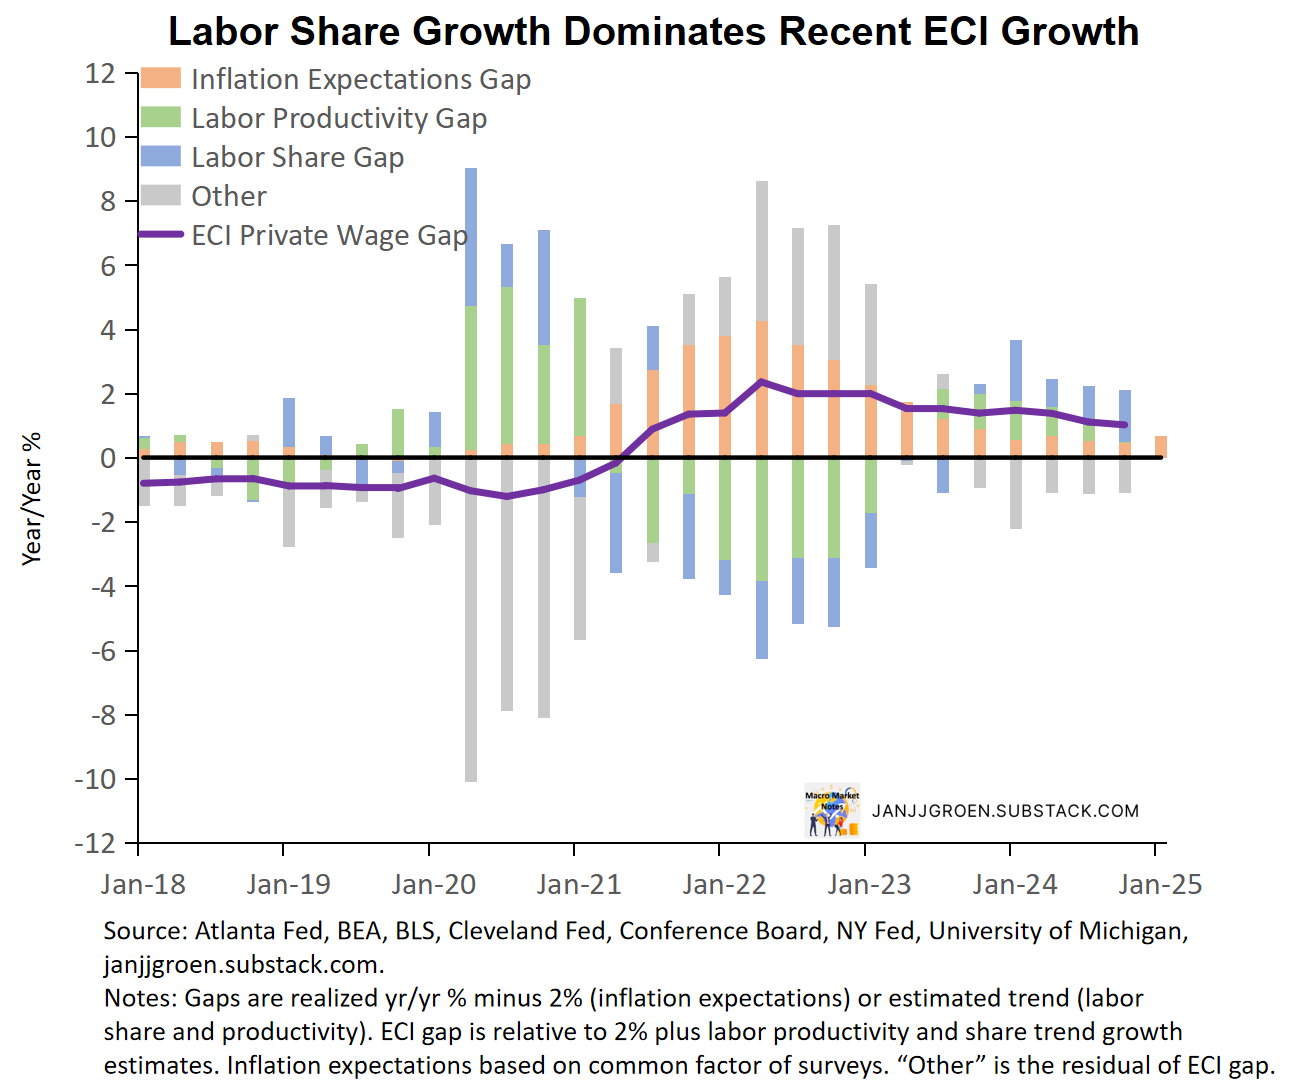
The chart above shows that since mid-2021 the ECI private sector wage growth gap has been persistently positive (above a pace consistent with 2% over the medium term), as the inflation expectations gap turned positive in a sizeable way. Throughout 2023 and early 2024 the impact of above-trend inflation expectations declined whereas the impact of above-trend labor productivity gained in importance.
However, the most notable development in 2024 has been the rapid increase in the contribution of above trend labor share growth (blue bars in the chart above) to elevated wage growth. This is in line with the wage income revisions in the August PCE report and reflects a major revision from the previous vintage of data. In 2024, workers’ share of business revenues is increasingly outpacing longer-term trends, which has become the main driver behind elevated wage growth.
Focusing on Q4 in the chart above, the inflation expectations gap equaled +0.47 percentage point, slightly down from +0.52 percentage point in Q3, whereas the labor productivity growth gap contribution decreased from +0.52 percentage point to +0.02 percentage point in Q4. The labor share gap contribution is really the component that has been increasing notably: from +1.19 percentage point in Q3 to +1.61 percentage point.
Beyond Q4, “Main Street” inflation expectations as of October suggest that the inflation expectations gap will likely contribute somewhat more to ECI private wage growth in Q1 2025. Also, given that the gap between the current and trend levels of labor productivity is closing year/year labor productivity growth would be unlikely to remain a major upward force behind wage growth. Thus, going into 2025, inflation expectations of firms and household likely will keep wage growth above inflation target-consistent pace. But if above-trend growth in the workers’ share of business revenues persists inflation expectations could accelerate further in 2025.