March FOMC Meeting: Rate Cut Uncertainty
The FOMC left rates unchanged, and with stable expected real rates, sticky spot inflation rates and solid growth rate cuts will not happen before mid-2024.
At this week’s FOMC meeting, the Committee again decided to keep the Fed funds rate target range unchanged. Chair Powell’s remarks today made clear that the FOMC will take its time before cutting its policy rate and the Fed will use the next two to three months to assess how temporary the disinflation seen towards the end of 2023 has been given the recent firming in core inflation as well as continued solid real economic activity expansion.
Key takeaways:
The FOMC decided to keep the Fed funds target rate unchanged at 5.25%-5.50%. At the post-meeting press conference, Chair Powell signaled a fairly soon start of a QT taper - very likely already at the May FOMC meeting.
Underlying core services inflation firmed recently while near-term “Main Street” inflation expectations shifted down since December.
The labor market and consumption spending cooled somewhat but remain relatively strong.
Expected near-term real interest rates have peaked in Q4 2023 and remained stable around those peak levels since then, with the twelve-month ahead perceived policy stance in March just about in line with the Fed’s own assessment of its stance for 2025 overall.
As the expected year-ahead real rate path remains contained and real economic activity levels remain firm, the FOMC will wait and assess progress in both spot inflation and inflation expectations data as well as labor market trends before deciding to cut policy rates.
My modal view remains for Fed funds rate cuts likely not to start until June 2024. There is, however, a risk cuts could commence later and/or the Fed signaling less cuts in 2024 in the June SEP if the disinflation pace in the spot inflation data remains muted over the next few months.
Stalling Disinflation and Cooler Economic Activity: Is it Transitory?
For a while the Fed has focused on developments in non-housing core services inflation, stripping out volatile core goods inflation as well as housing services inflation which is expected to ease given weak new rents. Non-housing core services inflation is mainly driven by:
Labor costs, as most of the categories in core services excl. housing inflation are labor-intensive in nature.
Consumption expenditures, as the bulk of U.S. consumption spending is traditionally geared towards services spending.
Momentum in PCE core services excl. housing inflation has been sticky around a 4% m/m annual rate for most of the time since 2021. But by late 2023 non-housing core services PCE inflation appeared to ease in a tentative sign that it might finally start to break free from the post-pandemic 4% trend. However, the January data at least partially reverses this disinflationary trend. (chart above).
Another key factor in the Fed’s assessment of progress on inflation normalization are near-term inflation expectations of firms and households, as these impact wage negotiations, price setting and spending. Research has shown that these types of inflation expectations are the stickiest and often are positively correlated with growth expectations of these same firms and households.
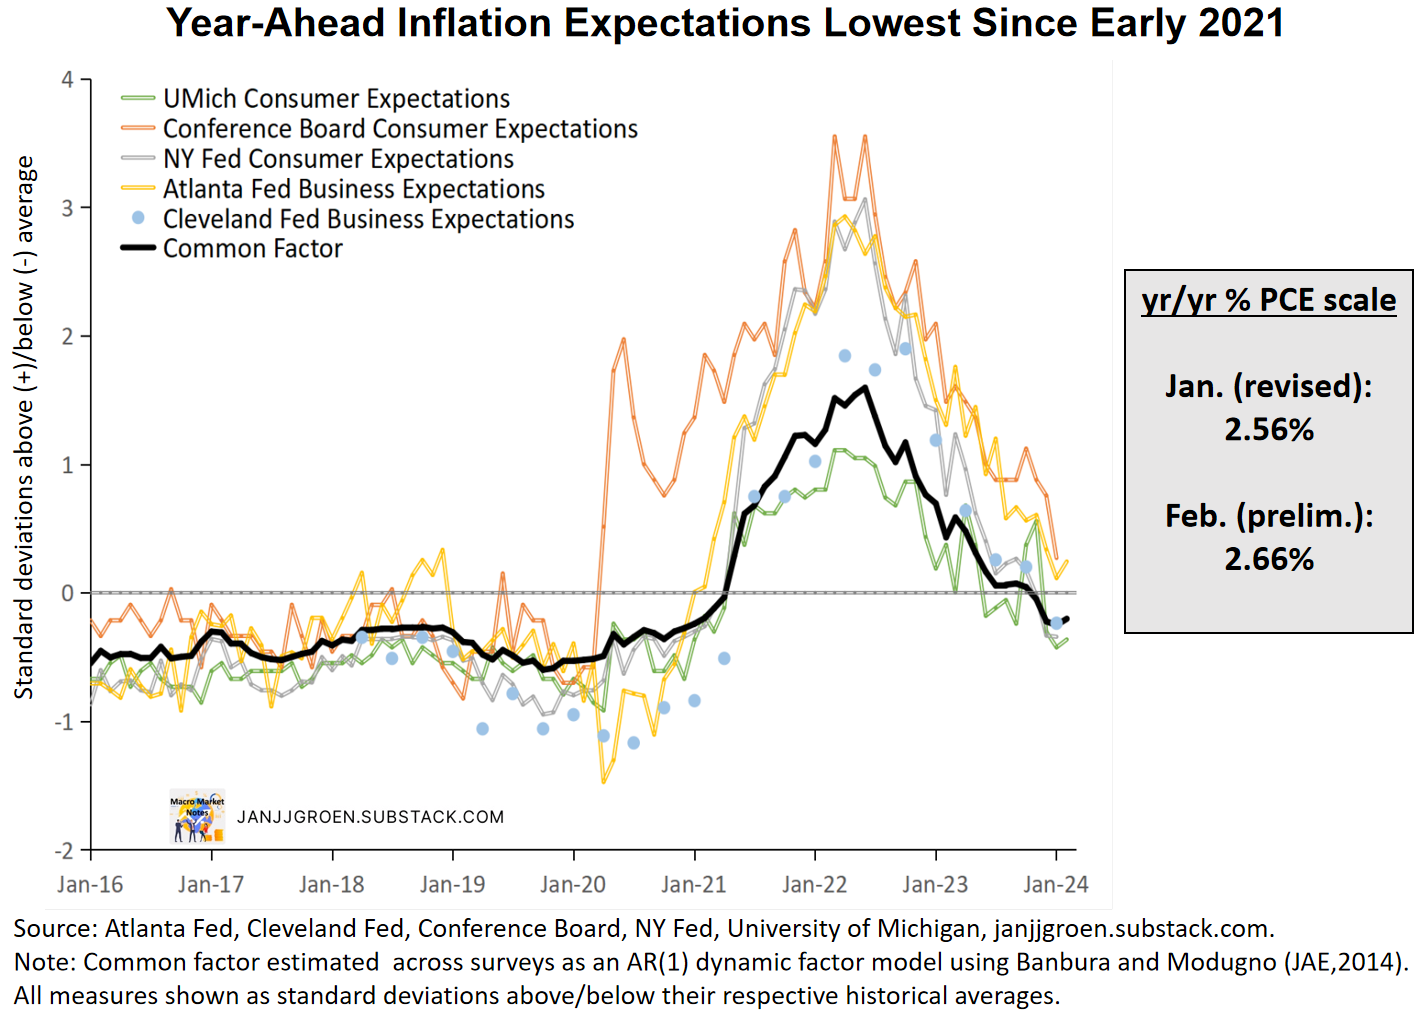
After last month’s update of my estimate of the common trend across firms’ and households’ inflation expectations, we note from the chart above that:
After sharply declining in 2023 H1, the common trend across near-term “Main Street” inflation expectations stabilized in July-October around a year/year PCE inflation equivalent rate of 3.2%.
Since November, near-term “Main Street” inflation expectations commenced easing again, to about 2.6% year/year PCE inflation equivalent rate in January -February. [Later this week I will circulate the March update of this “Main Street” inflation trend estimate, and it will show that for March the preliminary estimate reads just over 2.7% in PCE year/year terms.]
When taking together the news on inflation, both in spot and expectations space, over the past three months it has been a mixed bag for the Fed since the December meeting.
In terms of real activity, going into the new year the pace of expansion of the economy cooled somewhat but still likely remain solid as underlying consumption spending continues to suggest solid spending continue into at least 2024 Q1 (chart above). Households continue to be able to keep spending at a relatively firm rate supported by a still big pile of excess savings and growing income out of wages.
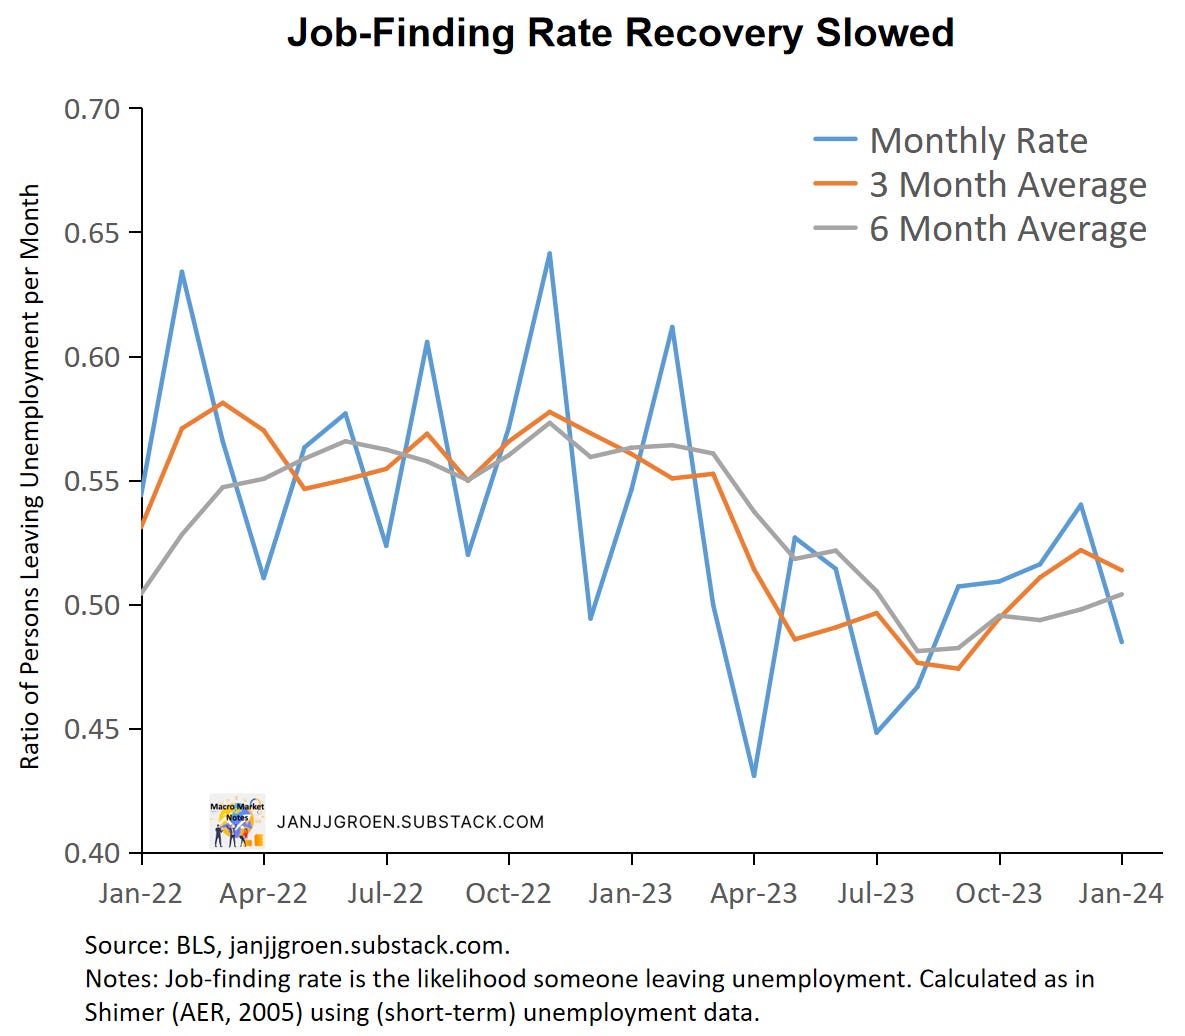
Additionally, February labor market data provided mixed signals regarding labor market strength. In February payrolls growth momentum remained firm with wage disinflation leveling off and outpacing the medium-run rate that is consistent with 2% inflation. There were, however, signs that labor demand might be starting to cool somewhat compared to the previous two months, as the job-finding rate dropped over the month, but multi-month average remain at a level that suggests the entry and exits into unemployment are for now in balance (chart above). Thus, over the next few months the Fed needs to make sense of two diverging trends: a possibly end to disinflation of core services prices versus a potential further cool down of labor market strength.
Real Rates: How Tight Is the Fed’s Policy Stance?
To gauge how restrictive the Fed’s interest rate policy is I published back in August an analysis that focused on a one-year survey-based real interest rate. This rate is calculated by taking the monthly average of daily one-year interest rates and subtracting the (monthly) common inflation expectations factor from the chart above that is scaled in year-on-year PCE inflation terms (updated with preliminary March data, as I will circulate later in the week).
Key to assessing the restrictiveness of these one-year real rates is where neutral real rates are heading. The chart above is an update of an earlier chart and shows that neutral real rates have trended up since 2016. More recently, they have plateaued since the fall with the average across the proxies close to a 1.3% rate, close to the pre-GFC trend.
Based on numerous remarks from Fed officials, the Fed is convinced its policy stance is restrictive enough to bring inflation sustainably back on a path towards 2%. The perceived policy stance as depicted by the survey-based one-year real rate in the chart above only became significantly restrictive (by rising beyond the majority of approximate neutral real rate levels) after the May FOMC meeting. Since then, the expected restrictiveness of the Fed’s policy stance peaked in Q4, as inflation expectations eased, and have been stable around this peak for now in 2024.
The Fed’s Own View
FOMC members updated their forecasts for inflation, growth the unemployment rate and the Fed funds rate at this meeting. The inflation outlook was modified relative to December, especially for 2024 where 2024 Q4/Q4 core PCE inflation projection was upgraded to 2.6% from 2.4% previously. Beyond 2024 the Q4/Q4 core PCE inflation projections remained unchanged at 2.2% and 2% for 2025 and 2026, respectively. The SEP projections for growth and unemployment in 2024 became rosier compared to the December SEP, with GDP growth being upgraded from 1.4% to 2.1% Q4/Q4 and the unemployment rate for Q4 ticking down to 4% from 4.1%. Also, for 2025 and 2026 the March SEP seems to suggest that GDP growth remains above trend at 2% Q4/Q4, while in December the projections for those years signaled a return back to trend.
Despite a higher projected core PCE inflation for this year as well as a more benign real activity outlook, the Fed funds projection for 2024 in this updated SEP suggest an unchanged amount of three rate cuts. The number of cuts for 2025, on the other hand, decreased by about one.
As discussed earlier the range of R* estimates from models and financial markets data suggests that R* shifted up towards a level close around 1.3%. The Fed’s quarterly Summary of Economic Projections (SEP) provides a clue about the range of views within the FOMC on R*, using the central tendency for the longer run Fed funds rate and PCE inflation, respectively. The chart above suggests that compared to December FOMC members’ own assessment of the neutral real rate only shifted up marginally, despite a number of FOMC members (e.g., Mester, Kashkari) publicly stating they are considering a possible upgrade in their R* projection, but it was enough to shift up the median R* estimate from 0.5% to 0.6%. However, the Fed’s R* guesses still generally lag estimates from models and market data.
The chart above contrasts my surveys-based one-year real rate relative to the average of model- and market-implied R* estimates with a proxy of the Fed’s view on this real rate gap using information from its own Summary of Economic Projections (SEP). This chart suggests that expectations from “Main Street” and markets for early 2025 are broadly in line with the Fed’s assessment of its policy stance for 2025 overall. This likely reflects a slightly stickier inflation outlook going into 2025 on the side of “Main Street” and markets versus the Fed.
However, the chart above also makes clear that survey-based expected real interest rates remained stable going into 2024. With expected real interest rates not trending up it gives the Fed room to be patient in assessing upcoming inflation and labor market data.
Looking Beyond the March FOMC Meeting
Going into 2024 signs of disinflation have faded based on the spot inflation data for January and February with data on GDP and consumption remaining relatively upbeat. Despite this the Fed still is signaling three rate cuts for this year, which gave the impression that the Fed has become more tolerant of persistently elevated inflation rates and has shifted its attention more to the employment side of its mandate. Chair Powell’s remarks at the post-meeting press conference that emphasized a return to target “[…] over time” as well as his remarks pointing to unexpected labor market weakness as a rationale to start easing policy only reinforced this view. On the other hand, relative to the December SEP the number of FOMC members that wanted to dial back 2024 rate cuts from three to two grew notably and the distinction between two or less rate cuts in 2024 and three or more became more even side than previously was the case.
It is more likely, in my view, that high inflation volatility over the past 12 months have made FOMC members much more indecisive about the start and magnitude of policy easing in the near term. And as expected year-ahead real rates are not rising further and still robust real activity expansion, this means that the Fed can afford to be patient in determining the start date of rate cuts to further assess whether inflation has enough momentum to easing back to 2% over the medium-term. My modal view, therefore, remains that we are not going to see a move toward policy rate cuts before the June 2024 FOMC meeting. But a lack of disinflation pace in the spot inflation data over the next two to three months, combined with a further upgrade in the Fed’s R* views, poses a risk that the Fed will feel compelled to either start cutting the Fed funds rate later and/or signaling a notably lower number of rate cuts for 2024 in the June SEP.


