


April Personal Income & Outlays: Cautious Households
Near-term trends in underlying inflation firmed and remained above 2%. Consumption growth slowed while savings grew, but wage income growth was stronger.

The April Personal Income and Outlays report provides a good insight into the U.S. consumer as well as inflationary pressures going forward. This note presents some of these insights.
Key takeaways:
The central tendency measures of PCE inflation firmed up over the month and remain 2.6%-2.8% core PCE inflation range on a six-month basis.
Personal income growth out of wages and salaries was revised up for Q4 and Q1 and accelerated in April. This meant that household wage income now is growing somewhat above the pace that’s consistent with 2% PCE inflation over the medium-term.
The stock of excess savings has NOT run out and continues to be a tailwind for consumption. Between March and April, it increased by around $1.3 billion and equaled about $298 billion in April.
Headline consumption growth on a three-month basis reaccelerated well above its underlying spending growth pace in April but slowed notably over the month. Real spending on durable goods fell and services consumption grew over the month. The annual trend in real spending picked up as well, so one should not expect dramatic downshifts in the second half of the year.
While consumption spending slowed as households added to their precautionary savings, stronger-than-expected wage income growth means this will not counteract elevated inflation and trends in underlying inflation still point to an above-target medium-term core inflation pace. Given this the Fed will likely abstain from further rates cuts for quite a while, as it gauges how much supply-side disruptions owing to trade policy could derail the inflation process through elevated inflation expectations.
Medium Term Underlying Inflation Stubbornly Elevated
Core PCE inflation accelerated somewhat in April but was weaker than expected at 1.4% annualized monthly rate vs about 1.1% (upwardly revised from 0.3%) in March. Core goods inflation jumped up in April to +3.3% annualized month/month after recording -3.2% in March (essentially unrevised). Core service inflation, on the other hand, slowed notably, to 0.8% annualized month/month in April from an upwardly revised 2.5% in the preceding month.
Weakness in the Fed’s favorite gauge of underlying inflation, core services excl. housing PCE inflation, was the driver behind slowing overall core services inflation, as it sank from (an upwardly revised) +1.8% annualized month/month in March to about -0.3%. Given the large volatility in this measure since the pandemic it is better to smooth through noisy month-over-month dynamics.

The chart above plots three-, six- and 12-month annualized inflation rates for the non-housing core services PCE deflator. The average annualized monthly rate reads about 3.9% for the post-COVID era (black dashed line), almost two times the average rate we observed for the immediate years pre-COVID.
Momentum in this non-housing core services inflation measure continued to ease with the three-month annualized inflation rate decelerating from 4% to around 2.7% in April. Furthermore, the six-month rate also declined somewhat. Note that since early 2024 the twelve-month rate had been range bound around 3.5%, but for March and April it eased to about 3.3% and 3% respectively. With non-housing core services contributing about 55%-60% to core PCE inflation, if the year/year would stay around 3% this would still push up core inflation structurally higher by about 50-60 basis points vs. 2016-2019, all else equal.
Instead of focusing on whether specific components of inflation should be ignored or not when assessing underlying inflation trends, one could focus on the central tendency of consumer price inflation, a.k.a. the center of the distribution of all price changes unaffected by extremely volatile consumer price components. This could potentially provide a better sense of the target toward which inflation moves over time once those excessively volatile price changes have stabilized.
Such measures of central tendency for the PCE price indices use a variety of trimming procedures to weed out excessive volatile components of these price indices in a given month:
Median PCE, which takes the inflation rate of the component at the 50% percentile of the PCE component price changes.
Trimmed Mean PCE (Dallas Fed), where the highest 31% and lowest 24% of PCE component price changes are dropped.
15% Trimmed Mean PCE, where the highest 7.5% and lowest 7.5% of PCE component price changes are dropped.
20% Trimmed Mean PCE, where the highest 10% and lowest 10% of PCE component price changes are dropped.
30% Trimmed Mean PCE, where the highest 15% and lowest 15% of PCE component price changes are dropped.
While these trimmed mean inflation measures eased over the month in March, they all reaccelerated on a month/month basis in April. Scaled in month/month core PCE inflation, April figures ranged from 2.1% (10% trimmed mean PCE) to 3.2% (median PCE).
To get a sense of near-term trends in underlying PCE inflation I look at six-month averages of the annualized percentage point deviation of the above monthly central tendency inflation measures relative to their values as implied by 2% core PCE inflation. This is also consistent with public statements by Fed officials that they’d like to see sustained progress of inflation converging back to target, as measured over months and quarters of inflation progress.

For most trimmed mean PCE inflation rates the six-month average deviations relative to the inflation target troughed by the end of the summer of ‘24 (chart above). Since then, these six-month measures have steadily been on the rise, and by February these measures were implying a six-month pace of in the 2.8%-3% core PCE inflation range. In March and April these eased somewhat but remained in a 2.6%-2.8% core PCE inflation range in April — well above the Fed’s 2% inflation target.

The chart above looks at three-month average deviations from 2% core PCE inflation across the underlying PCE inflation measures and, similar to the six-month averages, have generally been rising between September and February. And although these three-month averages stepped down in March today’s report suggests an across-the-board reacceleration in April, with a spread in April from about 2.4% (10% trimmed mean PCE) to 2.8% (median PCE). So, heading into the “Liberation Day” month there was not much easing in near-term underlying inflation trends in the pipeline when the tariffs hikes made their impact.

On an annual basis, 12-month average deviations of underlying PCE inflation rates relative to the inflation target in the chart above also eased but generally continue to suggest a longer-term pace around 2.5% core PCE inflation.
Wage Income Growth Rebounded
There were significant upward revisions to the recent path of household income out of wages and salaries, especially for Q4 and Q1. The year/year wage income growth rate in April accelerated to 4.5% from 3.6% in March (revised up from 2.9% previously).
To interpret wage income growth trends, I earlier proposed to compare wage income growth with a neutral benchmark growth rate based on trend non-farm business sector (NFB) output growth and either the abovementioned common inflation expectations factor or the 2% Fed inflation target. Similar to what I did when discussing wages and inflation expectations in my October 2023 update, I now also incorporate trend labor share growth into this neutral benchmark.
Any deviation in actual household wage income growth above or below the aforementioned inflation target-consistent neutral benchmark means household wage income growth outpaces or cannot sustain in the medium term the 2% inflation target.
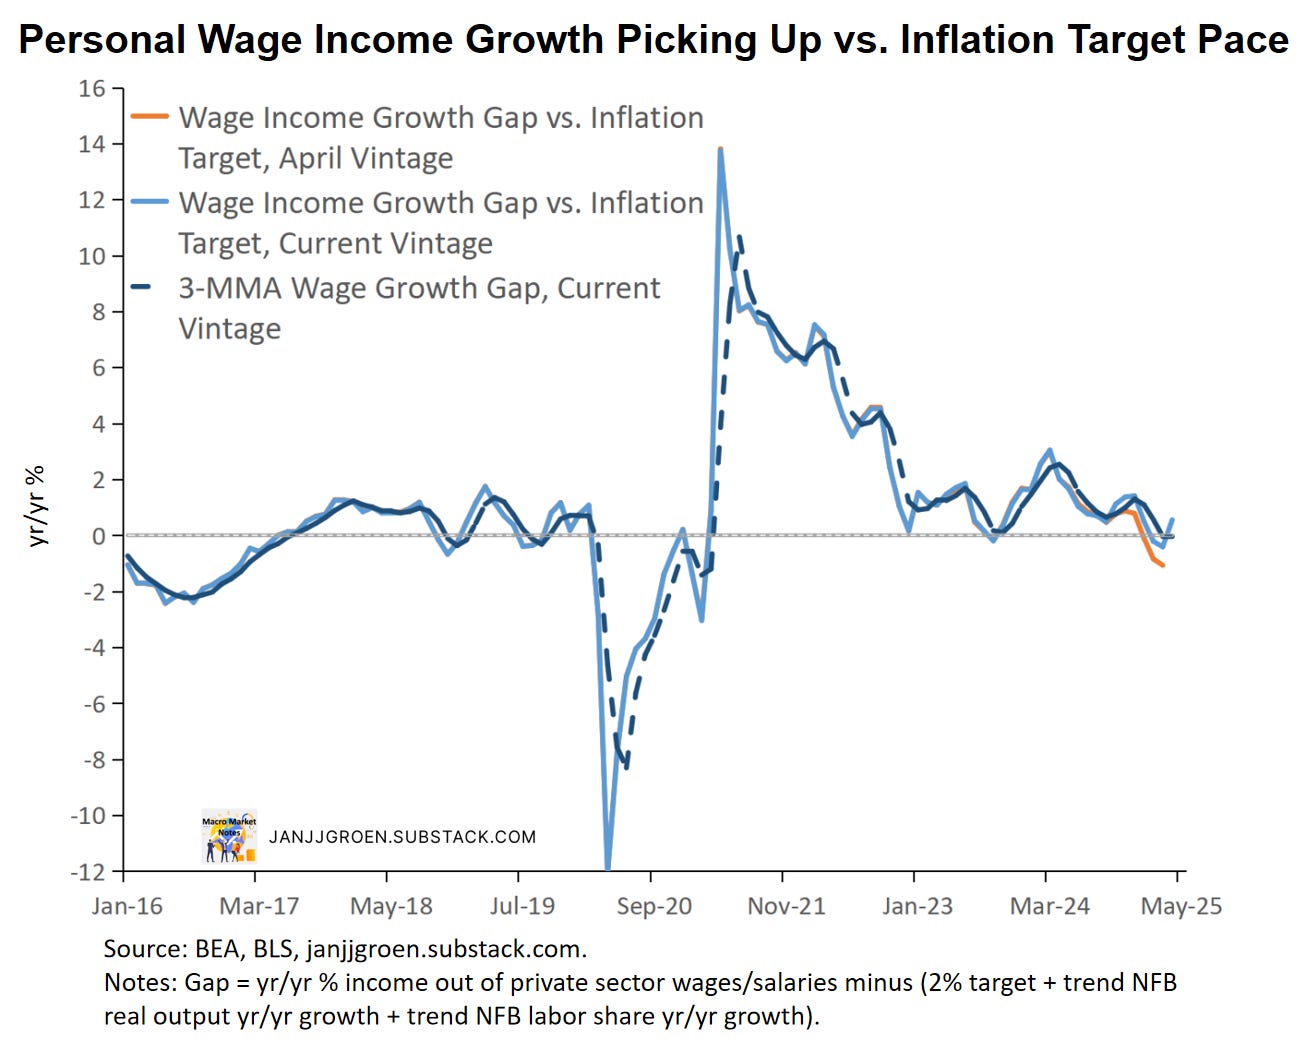
The chart above shows that based on the previous data vintage the wage income growth gap vs the 2% inflation target pace shrank throughout Q1 with it falling below the pace consistent with 2% PCE inflation (orange line). Using today’s data vintage, however, this Q1 slowing was a lot less severe and April household income growth out of private sector wages accelerated (blue line), which meant that current wage income growth is now again (somewhat) above the pace consistent with 2% PCE inflation over the medium term.
Smoothing the nominal wage income growth gap over three months today’s report suggests that household spending growth appears to be still more or less consistent with a sustainable return of inflation to 2%.
Nominal consumer spending increased 0.2% over the month in April, with disposable household income growing 0.8% for the same period. As a consequence, the savings rate increased to 4.9% in April compared to 4.3% previously (upwardly revised from 3.9%).

Over the month the savings rate increased to a level in line with my trend savings rate estimate of about 5% in April using the ‘average of trend’ approach outlined in my earlier excess savings note (orange line in the chart above). This trend savings rate estimate has been essentially unchanged since December.
Using these estimated trend savings rates, the chart above shows that above-trend growth in disposable income continues to be a partial offset to the drawdowns in excess savings coming from above-trend growth in both consumption spending and interest payments (green bars vs orange + blue bars). With upside revisions to my personal income estimates for Q1, April cumulative excess savings increased from $296 billion in the previous month (revised down from $403 billion) to about $298 billion (see chart above). Households (especially middle- and higher-income ones) continue to have access to a sizeable buffer to deal with shocks and higher-than-expected price increases with continued policy uncertainty providing an incentive to add to this stock of precautionary savins.
Real Consumption Growth Slowed
Over the month inflation-adjusted consumption expenditures rose 0.1%, a slowdown compared to a +0.7% growth rate in March but above the 0% in February. Some durable goods categories saw a decline in real terms whereas real services consumption remained strong: real durable goods consumption fell 0.8% month/month after increasing 3.8% in March whereas real services consumption went from +0.4% in March to +0.3% in April. The latter was foreshadowed by the very solid inflation-adjusted bar/restaurant spending growth rate in the April retail sales report.
As is the case with headline inflation, headline real consumption spending growth often is driven by volatile components that not always reflect the underlying strength of the economy. An underlying real consumption spending growth measure, therefore, would be really useful, and I do that by approximating such a core measure based on the weighted median across 177 components1 of headline real personal consumption expenditures (PCE). More specifically, the underlying consumption growth measure equals the growth rate of the real PCE component at the 50% percentile across growth rates of these 177 sub-components of headline real PCE.

The chart above focuses on three-month annualized consumption growth rates. Real consumption spending firmed up from 1% in March (downwardly revised from 1.7% previously) to 3.4% in April. April headline three-month consumption growth further accelerated away from the underlying, median, consumption growth rate of 1.4%. However, if we calculate Q2 consumption growth properly from the monthly data and assume growth for May and June settles at the April median annualized month/month pace of 1.2%, there’s the possibility of a negative growth rate over Q2 for real consumption.

As the chart above shows, on an annual basis headline real consumption growth still runs above the median growth rate, with the latter implying 2.8% growth year/year. So as long as wage income growth remains solid, consumption growth should not slow too much with real spending remaining solid and close to trend in upcoming quarters. Consumption growth isn’t signaling a recession just yet.
Underlying inflation rates accelerated again in April, with the trends in these rates still pointing to above-target inflation dynamics. Real spending is slowing as households added to their stocks of precautionary savings, but household wage income growth remains solid signaling less of a disinflationary tendency coming from households going forward. The Fed therefore will remain cautious and likely not ease rates for a while in 2025.
For a description of these 177 components, see Appendix A in the Dallas Fed trimmed mean PCE inflation working paper, where I use the corresponding real quantities instead of the price indices.