


Feb. Payrolls: Still Stable
February payrolls growth was reasonable, but the unemployment rate ticked up due to a declining job-finding rate. Wage growth remains sticky above trend.

Today’s release of the February Employment Situation report continued to show a labor market with low hirings and low layoffs as well as above-trend hourly wage growth - similar to what we have seen in previous reports. Payrolls growth trends, however, barely can keep up with a still elevated breakeven pace, although the latter should come down later in the year as population growth slows.
Key takeaways:
Payrolls growth rose in January, but near-term trends barely can keep up with the breakeven pace needed to keep the unemployment rate constant at current levels based on higher population projections.
The unemployment rate increased to 4.1% as the labor force participation rate declined to 62.4%.
The job-finding rate deteriorated over the month to 45% with smoothed trends at similar levels. The unemployment rate consistent with recent job-separation and job-finding rates increased but smoothed trends suggest that in the near term the unemployment rate will likely remain stable around 4.1%.
Wage growth in composition-adjusted average hourly earnings remains elevated at paces inconsistent with both the 2% inflation target and near-term inflation expectations.
Today’s data means the Fed is confronted with a very uncertain outlook with on the one hand a stable but fragile labor market, but on the other hand a pickup in inflation momentum. For now, the Fed will remain on hold.
February Jobs Growth: Solid but Not Great
The February jobs report released today indicated that payrolls in the establishment survey grew fairly close to the consensus expectation as they were up by 151,000 persons in February, compared to a 125,000 increase in the preceding month (which was revised down from 143,000 initially). Payrolls growth for December and January combined were revised down by 2,000 persons.
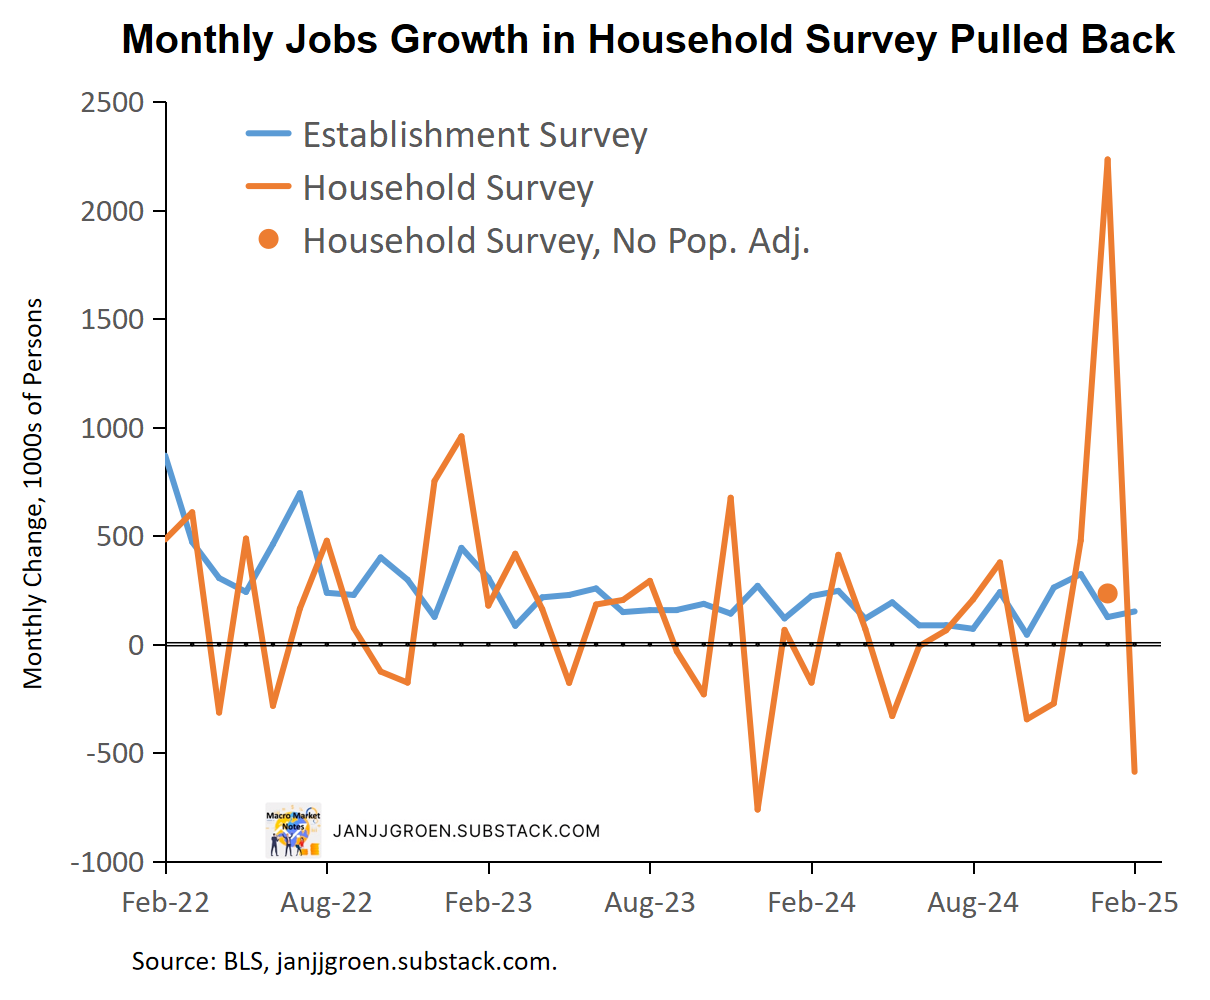
The unemployment rate ticked up 10bps to 4.1% in February. In three-digit terms the unemployment rate increased from 4.011% in January to 4.139%. Household employment grew in January by a significant 2.23 million people but without the annual working population update this would have been +234,000 persons (orange line vs orange dot in the chart above), but in February household employment change was -588,000 persons. Given the historical patterns in the chart above, this likely means upside risk to household employment growth in forthcoming reports as it likely reverts back in like with the establishment survey. Finally, the labor force participation rate ticked down by a notable 20bps to 62.4%; this is a main risk to keep an eye on for the growth and inflation outlooks.
Underlying Labor Market Trends

The chart above shows both the monthly and three-month moving averages of payrolls changes from the establishment survey since February 2022. The smoothed trend in payrolls growth eased somewhat but remains well above levels seen in the fall. Now let’s compare this smoothed trend with the estimate of the breakeven payrolls growth pace that keeps the unemployment rate constant in a given month is conditional on the BLS’ population growth estimates as well as the labor force participation rate in that month. This month this breakeven pace hit 110,000 persons, close to where it had been throughout 2024 (purple line in the above chart). Compared to the three-month average payrolls growth rate this would suggest that the labor market is creating jobs at a healthy pace.
However, while in January the BLS adjusted its population level for upgraded net immigration projections, the pre-2025 population remained uncorrected and remain well behind pre-2025 population from other institutions like the CBO. The CBO estimates that the working population grew 1.4% in both 2023 and 2024, with the pace to slowdown in 2025 to 0.9%. The chart above therefore also includes an adjusted breakeven payrolls growth pace for a constant unemployment rate, which adjusts the BLS’ population projections for 2020-2025 to bring them line with the CBO’s 2020-2025 noninstitutionalized population estimates (gray line in the chart above). The CBO-implied breakeven pace needed to keep the unemployment rate at 4.1% is around 215,000 persons in February, down from its 224,000 persons peak in December, and comparing this to the three-month average payrolls growth rate (orange vs. gray lines in the above chart) suggests that currently job growth barely can keep up this more realistic breakeven pace. This suggests there’s no imminent improvement forthcoming in the unemployment rate over the near-term.
Additional details about the underlying strength of the labor market can be inferred from the household employment survey. Following Shimer (AER, 2005) and Shimer (RED, 2012), we can use data on total unemployed and employed persons as well as the number of people that are unemployed for less than 5 weeks to estimate:
Job-finding rate: the probability an unemployed person in month t will find a job or leaves the labor force. This is calculated assuming that total unemployment in month t+1 equals month t unemployment plus the number of people unemployed for less than 5 weeks in month t+1.1
Job-exit rate: the likelihood an employed person in month t will exit its job either due to layoffs, quits or retirement, which depends on data on the job-finding rate, unemployment and labor force.2
The chart above shows a plot for the estimated job-exit rate. This job-exit rate has been relatively stable over the past two years, with a moderate downward shift in the first half of 2023 that stabilized between June and October but then rose again until this summer. Note, however, that the y-axis in the chart above also makes clear that the variability in the separation rate has been really modest.
The job-exit rate jumped up between June and August but has been decreasing notably between August and November (chart above). After picking up in the preceding month, it eased again from January going into February, reflecting historically low layoff and quits rates.

In 2023 the job-finding rate declined a lot after Q1 2023 (chart above) and this decline generally continued in 2024 to about 42% for October going into November, after which it recovered substantially in December and January. In February the overall number of unemployed persons grew faster than the number of newly unemployed persons (less than 5 weeks in duration): +203,000 vs. +47,000. Given that overall unemployment increased more than newly unemployment, the likelihood to exit unemployment between January and February deteriorated, with a job-finding rate equal to 45% for January going into February (chart above). Three- and six-month averaged job-finding rates for November into December settled at similar levels.
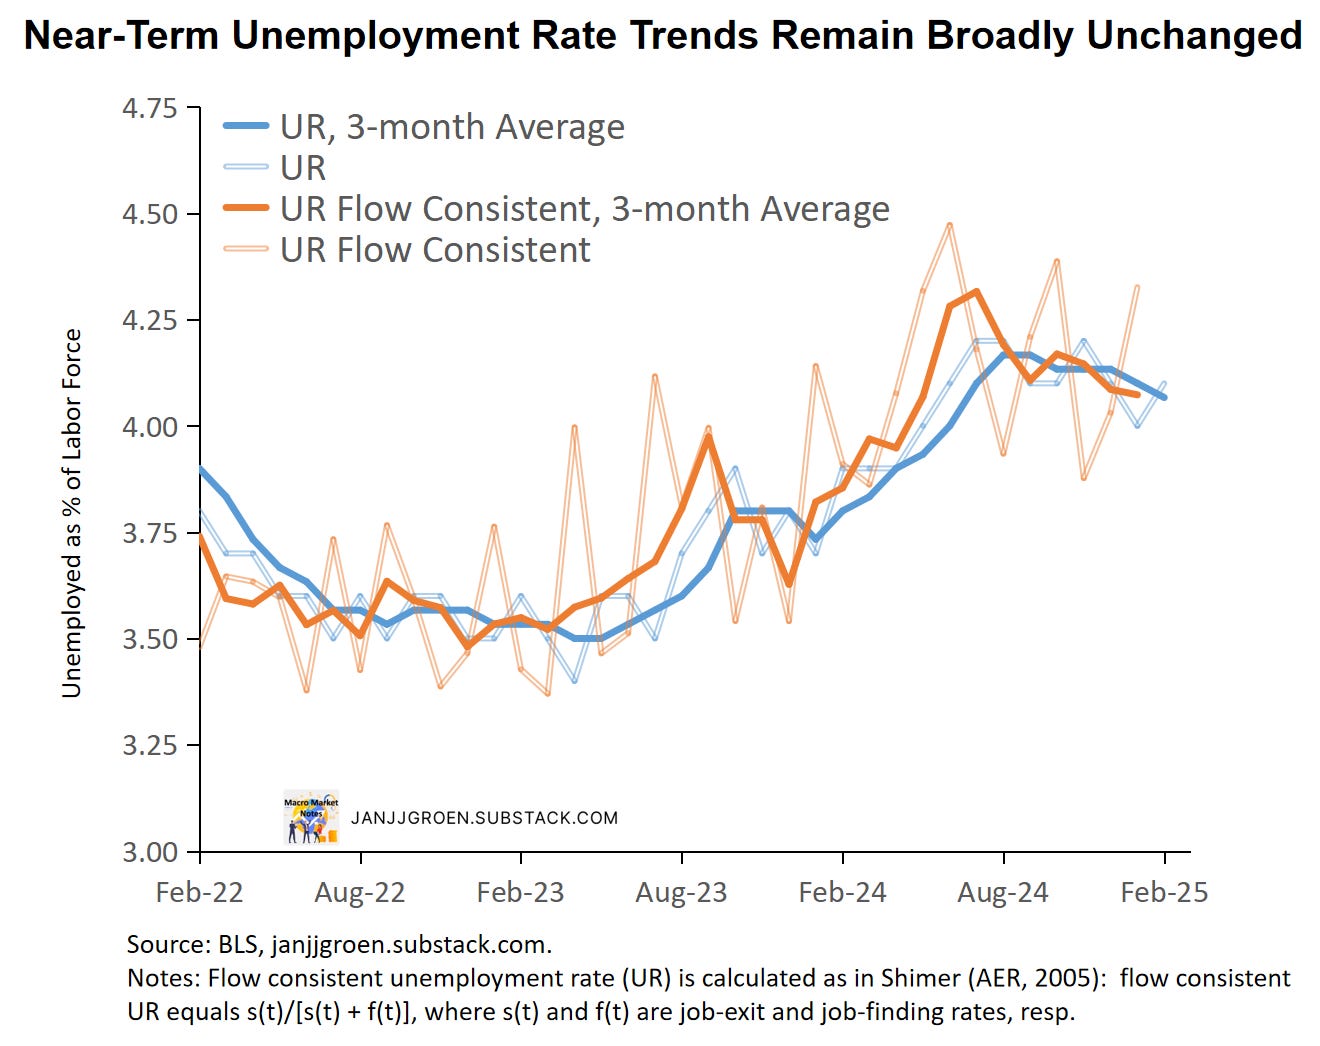
As in Shimer (AER, 2005) we can combine the above discussed job-exit and job-finding rates to calculate a flow-consistent unemployment rate and the chart above plots both the corresponding monthly rate and the three-month average of this rate. The (three-month average) flow-consistent unemployment rate is the unemployment rate that prevails when the job-exit and job-finding rates remain constant at their current (three-month average) levels. Deviations compared to the official unemployment rate should dissipate over time and frequently leads changes in the official rate.
The chart above shows clearly that the drop in the job-finding rate led to a substantial pickup in the monthly flow-consistent unemployment rate for January into February. Given the choppiness in this measure, it’s probably more useful to look at three-month averages. Throughout most of 2024 the flow-consistent unemployment rate on a three-month average basis had been outpacing the official unemployment rate and leading the rise in the latter (solid blue and orange lines in the chart above). This was largely driven by a deterioration in the job finding rate over that period, which reflected labor demand weakening. More recently, three-month averages of headline and flow-consistent unemployment rates suggest that over the near term the unemployment rate will likely remain relatively stable around 4.1%.
Both smoothed payrolls growth trends and the job lows data show signs that the labor market remained stable close to its underlying equilibrium, but only by a hair’s breadth.
Wage Growth Pace Drifting Up
Average hourly earnings of all private sector employees grew 0.3% month/month in February, down from 0.4% in January (downwardly revised from 0.5%), but picked up the pace in year/year terms from (a downwardly revised) 3.9% in January to 4.7%. For production and non-supervisory workers, hourly earnings also decelerated to 0.3% month/month in February from (a downwardly revised) 0.4% in the preceding month, and on a year/year basis growth accelerated from (a downwardly revised) 4% to 4.5% in February.
The wage data from the jobs report are notoriously noisy, given that they are revised often and do not correct for the sectoral and skills composition of jobs growth over the month. There are better quality wage data available, such as the Atlanta Fed Wage Growth Tracker and the Employment Cost Index, but the Atlanta Fed does construct a rudimentary composition correction for average hourly earnings from the jobs report, which can be found here.
When applying the Atlanta Fed composition correction on the monthly average hourly earnings for January, they remained at the official 0.3% (down to the corrected 0.4% for preceding month), and for production and non-supervisory workers the correction kept the rate at the official 0.3% in February and at 0.4% for the preceding month.

From the chart above one can observe that the three- and six-month wage growth rates have been drifting up since the fall. On a three-, six- and twelve-month basis composition-adjusted wage growth have running at or above 4% for most of 2024 and going into 2025.
I can combine labor productivity and labor share trend estimates with the 2% inflation target, along the lines I have done in my “Wages and Inflation Expectations” notes and incorporating the 2024 Q4 update of productivity data to get a medium-run annual wage growth rate consistent with 2% inflation.
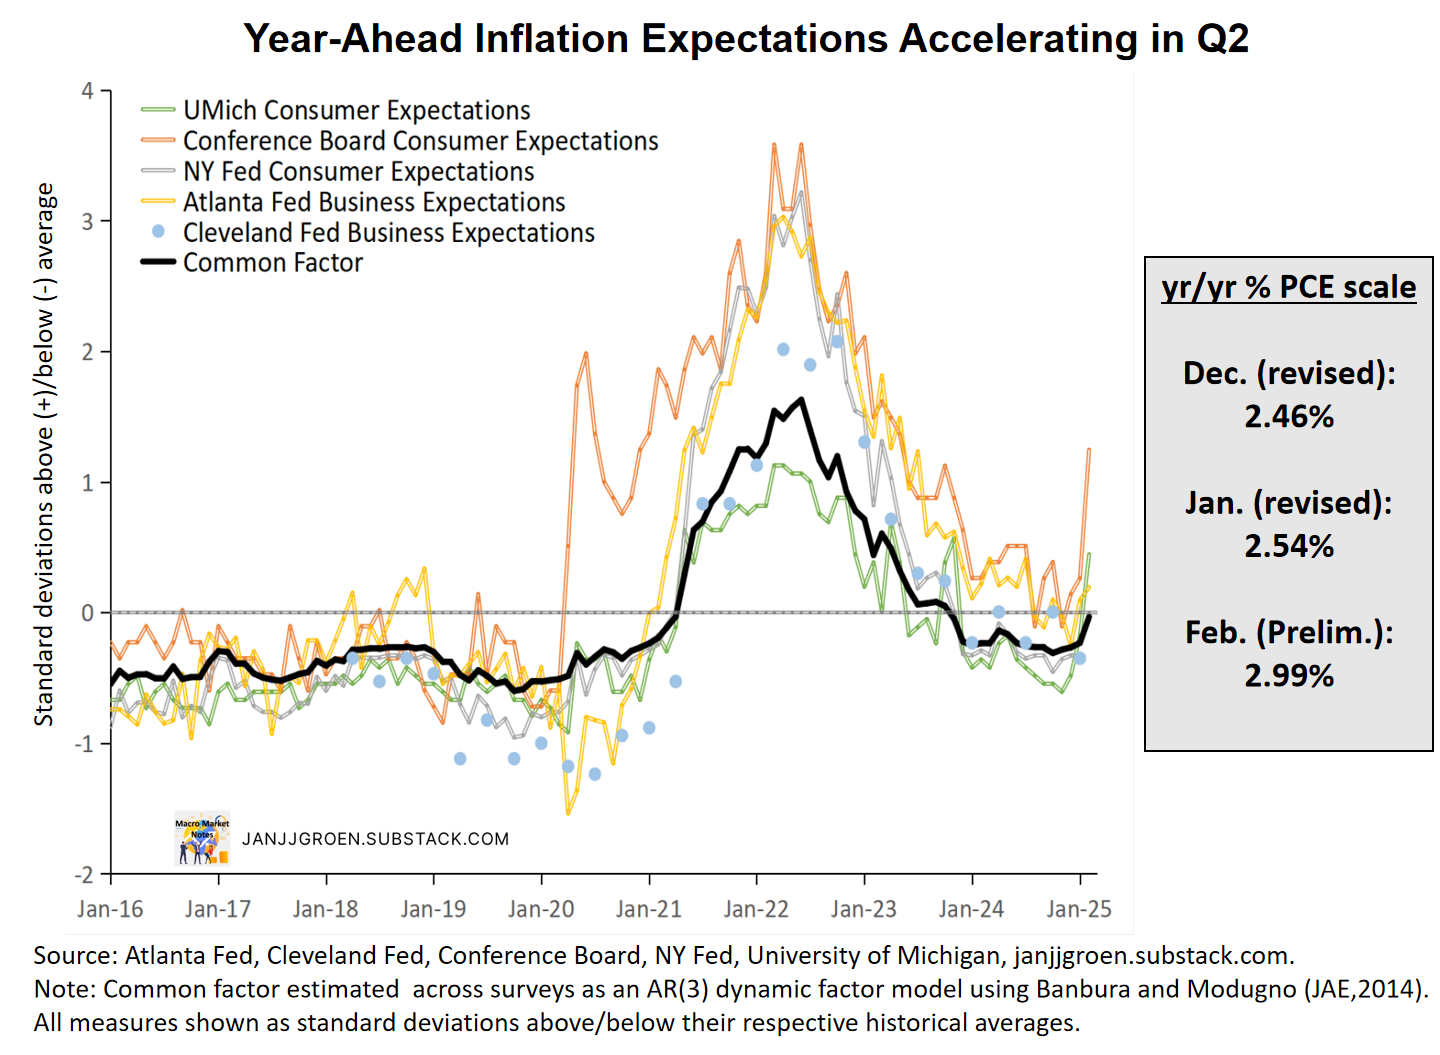
Additionally, instead of the 2% target one can use my “Main Street” year-ahead inflation expectations proxy, i.e., the common trend across survey-based near-term inflation expectations from firm and consumer surveys. After incorporating February data for the Conference Board, University of Michigan and Atlanta Fed surveys this estimate suggests "Main Street" inflation expectations in the chart above rose notably in February, from 2.4% y/y PCE inflation in Q4 to 3% in February—the highest since Nov. 2023. Inflation expectations among firms and households point to heightened near-term concerns amid policy uncertainty.

Compared to both the composition-adjusted AHE data for production and non-supervisory workers for February and the unsmoothed Atlanta Fed wage tracker into January, annual wage growth rates still outpace the 2.75% pace consistent with 2% PCE inflation in the medium term (green line in the above chart). In fact, wage growth also runs above the wage growth pace consistent with 3% PCE inflation implied by “Main Street” near-term inflation expectations for February (blue line in the chart above).
After the conclusion of the January FOMC meeting the Fed clearly signaled it is in no hurry to change policy rates any further given uncertainties regarding the inflation outlook as well as elevated policy uncertainty. Today’s February jobs report showed a labor market stuck in a fragile equilibrium with low hiring and layoffs - with the treat large scale tariff hikes looming this is something the Fed will take note of as a potential threat to its employment mandate. However, wage growth momentum remains stubbornly elevated, and we have a pick-up in underlying inflation momentum, so given the uncertainty regarding the execution of tariff hikes the Fed is likely to stay on hold to, at least, the May FOMC meeting.
Given this calculation, the job-finding rate will run up to December utilizing data on (short-term) unemployment for January.
As the calculation of the job-separation rate depends also on (short-term) unemployment for January, we cannot go beyond December.