March Payrolls: Here We Go Again
Stronger-than-expected March payrolls growth and a pick-up in job-finding rates means continued labor market strength. Wage growth slowed but remains elevated.
Today’s March Employment Situation report suggest continued strength in the U.S. economy, with payrolls growth accelerating, unemployment easing and wage growth slowing ever so slightly. It will likely make the Fed even more wary to starting easing policy too soon.
Key takeaways:
Payrolls growth momentum continues to pick up as payrolls in the preceding two months were revised up and comfortably runs above the breakeven pace needed to keep the unemployment rate constant.
The job-finding rate climbed again after slowing in January.
Wage growth slowed somewhat, but composition-adjusted average hourly earnings remain far above the pace consistent with 2% inflation.
Today’s data will mean the Fed remains patient and not start rate cuts soon.
March Jobs Growth: Again Accelerating
The March jobs report released today indicated that payrolls in the establishment survey again surprised to the upside as they were up by 303,000 persons in March, up from a strong 270,000 increase in the preceding month (which was broadly unrevised). Payrolls growth for January and February combined were revised up by 22,000 persons.
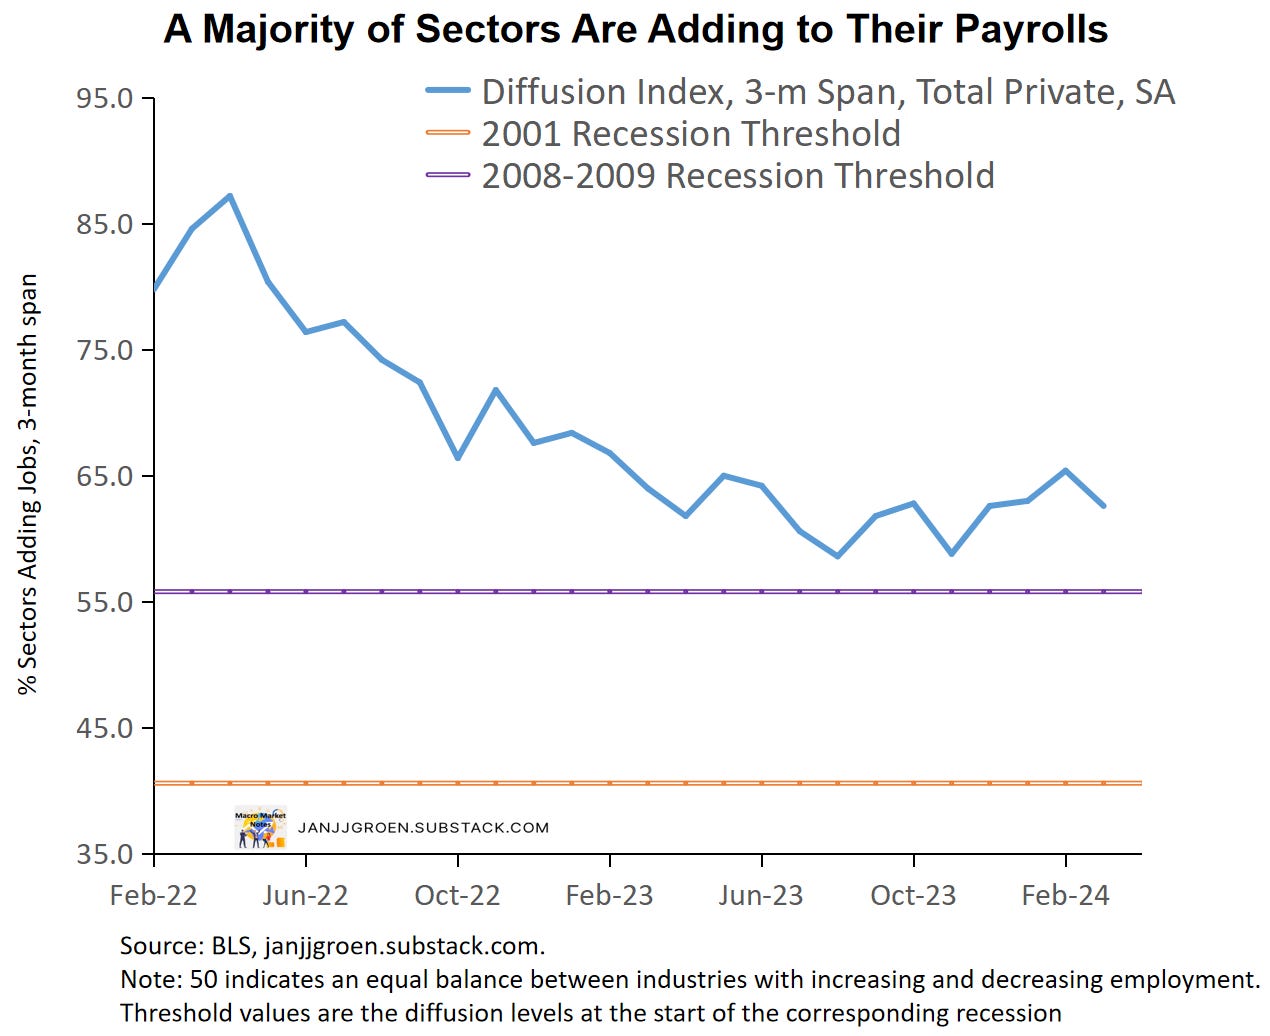
The breadth of payrolls growth has been a concern amongst Wall Street commentators and opinion makers alike. Compared to February, movements in sectoral breadth were mixed in March, with the one-month diffusion index of payrolls growth across sectors increasing from 58.6 (downwardly revised) in February to 59.4 and the three-month index declining from 65.4 (also downwardly revised) to 62.6 in March.1 The chart above illustrates that the balance between sectors increasing and decreasing payrolls over a three-month span deteriorated since the spring of 2022. This decline bottomed out by August 2023 at 58.6, approaching the level from the start of the 2008-2009 recession, and since then the breadth of payrolls expansion recovered towards levels not seen since in late 2022.
The unemployment rate decreased 0.1 percentage point to 3.8% in March, with household employment growth jumping up in March: from -184,000 persons in February to +498,000 persons. Meanwhile, the labor force went up by 469,000 persons, outpacing population growth in March (+173,000) resulting in a 0.2 percentage point increase in the labor force participation rate to 62.7%.
Immigration likely was a main driver behind the increase in the labor force participation rate in 2023, especially in the first half of 2023 (chart above). In March, however, the immigration component of the labor force participation rate declined on a year/year basis, whereas the native-born element increased. It is therefore likely that the higher labor force participation rate in March reflected not so much another expansionary labor supply shock, but rather an endogenous response of people on the margin outside of the labor force moving back in to take advantage of a strong labor market. In fact, the chart above seems to suggest that since the second half of 2023 the immigration impulse on the labor force has been fading.
The chart above compares the job growth signals from the establishment and household surveys, and it shows the excess volatility of the household survey relative to the establishment survey, with the former mean-reverting back to the latter relatively soon after big household survey moves in either direction. In March the jump in household employment growth clearly reflected such a mean-reversion dynamic after a three-month undershoot of jobs growth in the establishment survey.
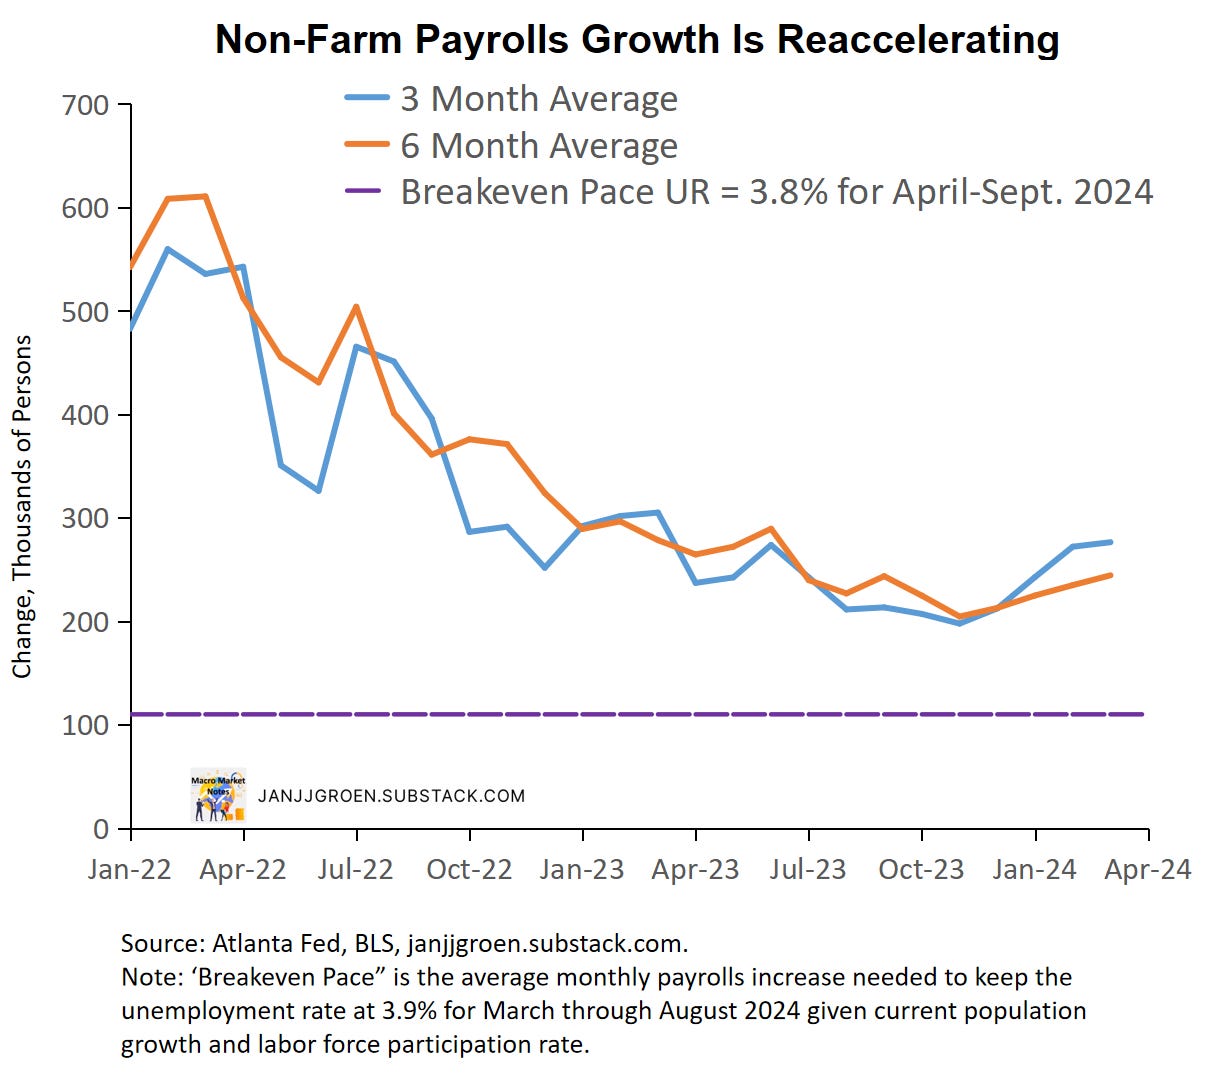
Moving beyond the month-to-month movements, the chart above shows three- and six-month moving averages of payrolls changes from the establishment survey since January 2022. The underlying pace of job creation in the U.S. economy slowed through October 2023 but since then the pace of payrolls growth picked up again. Given today’s data on unemployment and labor force participation, the smoothed trends in payrolls growth remain well above the breakeven pace needed to keep the unemployment rate around 3.8% over the next 6 months (purple dashed line in the above chart).
Additional details about the underlying strength of the labor market can be inferred from the household employment survey. Following Shimer (AER, 2005), we can use data on total unemployed and employed persons as well as the number of people that are unemployed for less than 5 weeks to estimate:
Job-finding rate: the probability an unemployed person in month t will find a job or leaves the labor force. This is calculated assuming that total unemployment in month t+1 equals month t unemployment plus the number of people unemployed for less than 5 weeks in month t+1.2
Job-separation rate: the probability an employed person in month t will either loses its job, quits or retires, which depends on data on the job-finding rate, unemployment and employment.3
The chart above shows a plot for the estimated job-separation rate. This job-separation rate has been relatively stable over the past two year, with a moderate downward shift in the first half of 2023 that stabilized between June and October. Note, however, that the chart above also makes clear that the variability in the separation rate has been really modest.
Since October job separations have ticked up, some of which was due to a step down in the labor force participation rate in Q4 2023 from 62.8% to 62.5%. With a stable labor force participation rate since the end of 2023 and minimal moves in quits rates, the January tick-up in separation rates likely reflected new rounds of layoffs that were announced in that month. For February, however, the separation rate declined despite further lay-offs in that month (chart above). This likely reflects my earlier observation that labor force participation improved owing to people coming out of retirement to take profit from a still strong labor market outlook.
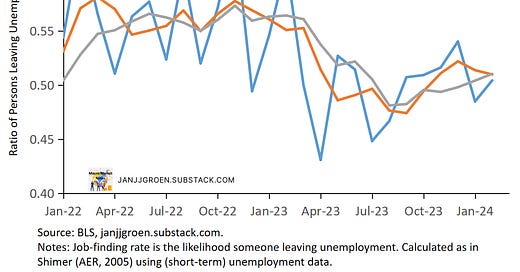
The job-finding rate declined a lot after Q1 2023 (chart above) and fell from a probability a person no longer is unemployed in a given month equal to around 55% in early 2023 to close to 45% by the summer. Given the earlier discussed decline in job-separation rate over the same period, this likely reflected a significant decline in hiring by firms as the supply of workers increased. However, since the summer the job-finding rate recovered and commenced an uptrend with the probability a person leaves unemployment in a given month rising to about 54% on the month and 52% on a three-month average basis in December.
In March both the total unemployed persons and the number of newly unemployed persons (less than 5 weeks in duration) declined (-29,000 and -137,000, respectively), which suggests that it became easier to exit unemployment in February. Consequently, the job-finding rate increased from to 48% to 50% in February (chart above). Three- and six-month averaged job-finding rates in February were at about 51%, which suggests that the labor market currently has settled at a steady state were entries and exits in and out of unemployment are broadly balanced.
Overall, the March establishment and household surveys both suggest underlying strength in the labor market. The establishment survey suggests we should expect to see a near-term pick up in the job-finding rate. The household survey indicates we should expect, for now, an unemployment rate that’s stable within the 3.8%-4% range.
Slower But Still Elevated Wage Growth
Average hourly earnings of all private sector employees grew over the month in February by 0.3% month/month, up from 0.2% in February, and ticked down in year/year terms from 4.2% in February to 4.1%. For production and non-supervisory workers, hourly earnings were up 0.2% month/month in March, down from 0.3% previously, and on a year/year basis they eased to 4.2% from 4.5% in February.
The wage data from the jobs report are notoriously noisy, given that they are revised often and do not correct for the sectoral and skills composition of jobs growth over the month. There are better quality wage data available, such as the Atlanta Fed Wage Growth Tracker and the Employment Cost Index, but the Atlanta Fed does construct a rudimentary composition correction for average hourly earnings from the jobs report, which can be found here.
We can observe from the chart above chart that by the end of 2023 the slowing in the composition-corrected average hourly earnings growth for production and nonsupervisory workers had stalled. Since then, however, these corrected wage growth rates started to ease again, to just below 4% across the different growth rates in March.
When I combine labor productivity and labor share trend estimates with the 2% inflation target, along the lines I do in my usual monthly “Wages and Inflation Expectations” note, the March medium-run annual wage growth rate consistent with 2% inflation remains at about 2.6% (purple line in the above chart). The Fed will need to see more progress on wage growth for it to be confident that especially core services PCE inflation is slowing enough to move core PCE inflation on a sustained path back to 2%.
Easy on Fed Easing
Public statements by FOMC members after the March FOMC rate decision continues to point to a Fed that is willing to be patient to assess the sustainability of the disinflation that has occurred. Especially so given the recent firming in spot core services inflation data. With the above discussed strength of the labor market, slow wage growth disinflation and slowing but still robust consumption spending, it is going to take a while for the Fed to commence with rate cuts. As before, I continue to expect a move towards policy rate cuts not earlier than in June.
50 indicates an equal balance between industries with increasing and decreasing employment.
Given this calculation, the job-finding rate will run up to October utilizing data on (short-term) unemployment for November.
As the calculation of the job-separation rate depends also on (short-term) unemployment for November, we cannot go beyond October.


