


Feb Retail Sales and March FOMC Preview
February real retail sales on goods excl. autos were strong, but real bar/restaurant spending continues to contract. The Fed will likely stay on hold.

This post reviews the February retail sales report and I’ll also preview the upcoming March FOMC meeting.
Key takeaways:
Inflation-adjusted retail sales were solid over the month for both core goods and core goods excl. motor vehicles in February, but on a three-month basis core goods sales were weak owing to contracting auto sales in January. Real bar/restaurant spending has been declining since December due to deteriorating consumer sentiment.
At the upcoming March FOMC meeting it is very likely that policy rates remain on hold for the second consecutive month. In the accompanying economic projections update, revisions will reflect a more elevated inflation pace for 2025 than previously expected as well as a less favorable GDP outlook. The expected number of rate cuts for 2025 will likely remain unchanged at two 25bps cuts. With ongoing policy uncertainty and near-term inflation expectations firming, post-meeting remarks will likely emphasize the role of inflation expectations and it possibly constraining future Fed policy actions.
February Retail Sales: Past the Trough?
Retail sales for goods increased 0.5% month/month in February compared to a (downwardly revised) 1.4% contraction previously. When interpreting retail sales data, it’s essential to look deeper:
Retail sales measures spending on goods as well as bar/restaurants spending. Thus, it really mostly measures goods consumption which is a relatively small slice of the monthly consumption basket, as about 2/3 of U.S. consumption expenditures relates to services.
Retail sales data does not correct for changes in prices, which for goods in particular can make a big impact. As such stronger retail sales growth, for example, could merely reflect more the pace of price increases while retail sales volumes were less benign.
Deflating retail sales with CPI or core CPI overlooks the predominantly goods-focused nature of retail spending.
Dissecting retail trade data into subcomponents and aligning them with corresponding CPI subcomponents provides a more accurate assessment. Firstly, when it comes to retail trade data (that is, retail sales minus nominal bar and restaurant spending) I use the CPI Commodities, CPI Gasoline, CPI New & Used Vehicles and CPI Motor Vehicle Parts & Equipment indices to inflation adjust over retail trade as well as components related to sales at gasoline stations and motor vehicle dealers & parts. In case of bar and restaurant spending I deflate that component by means of the CPI Food Away from Home index.
Furthermore, I apply chain-weighting based on the Fisher index approach using current period and previous period prices and quantities of retail trade and the gas and motor vehicle components to parse out the impact of the latter two volatile components. This approach allows for time-varying weights, as prices and quantities change from period to period and consumers substitute between the different spending categories. It is the same methodology used by the BEA to compute real consumption and GDP.

Real core goods spending (inflation-adjusted retail sales excl. gas stations) contracted again in February at -3.5% annualized three-month basis, essentially similar to January, as is evident from the chart above. Real core goods sales excluding motor vehicles, however, accelerated dramatically to a 6.9% three-month AR pace, after recording -4.8% in January (orange line in the chart above). Finally, inflation-adjusted bar and restaurant spending dropped -11.8% 3-month AR in inflation-adjusted terms in February, which was the worst 3-month rate since April 2023. (purple line in the chart above).
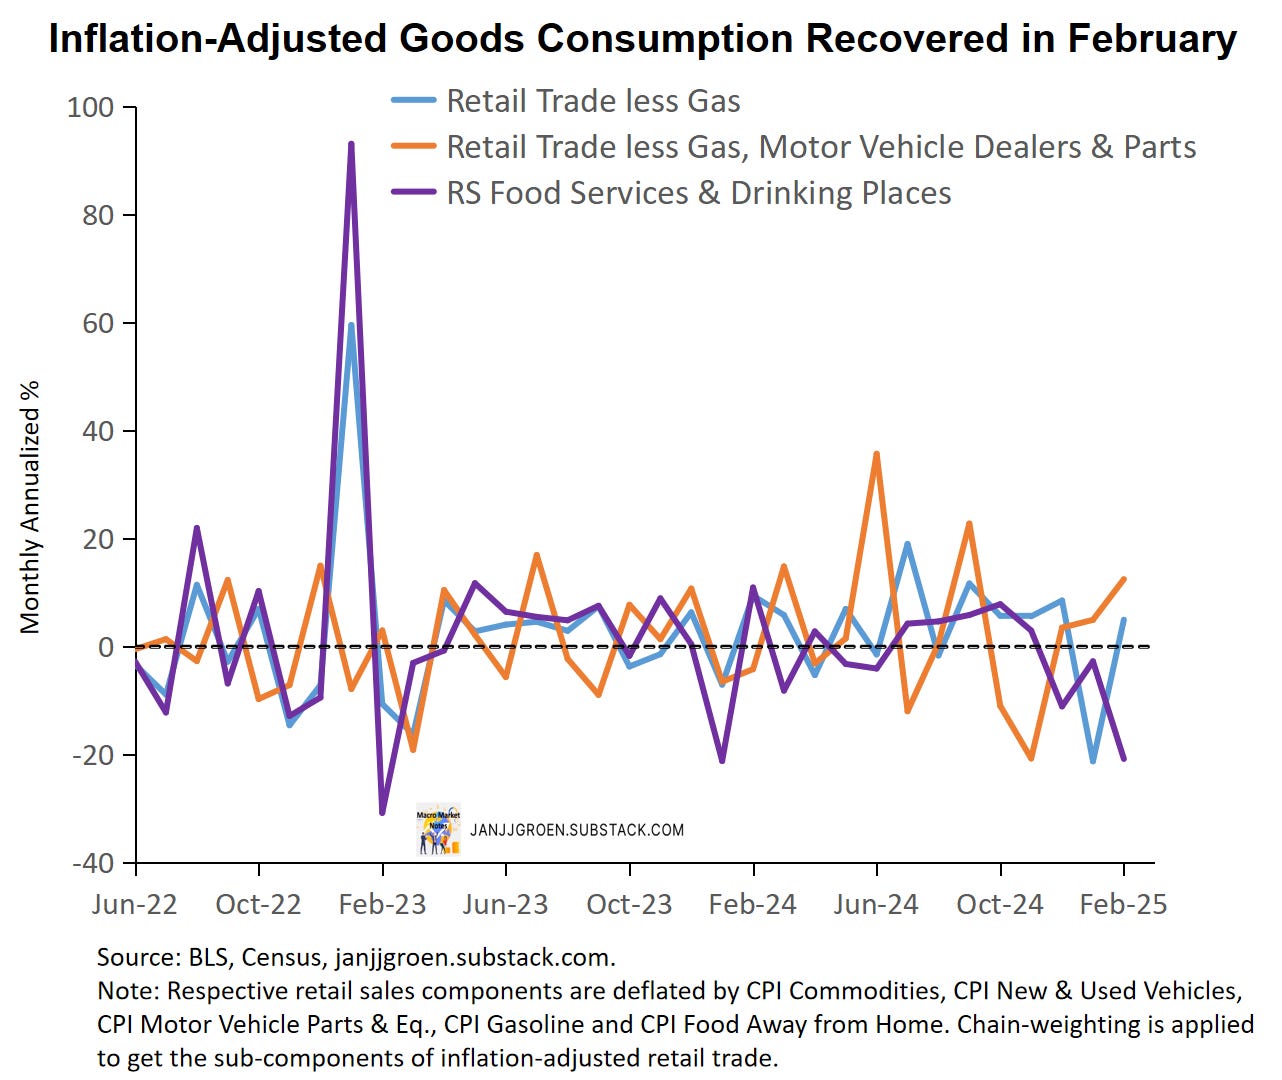
The chart above indicates that while the three-month growth pace of inflation-adjusted core goods spending was weak in February, on a monthly basis real goods sales excl. gas stations recovered in February to +5% AR after recording significant contraction in the preceding month at -21.2% (blue line). Compare this with the monthly rates of real core goods spending excl. motor vehicles (orange line), which has been expanding for three consecutive months since December (+3.4%, +5% and 12.5% month/month AR respectively). This suggests that the severe pullback in real goods spending in January was mainly due to an inflation-adjusted contraction in motor vehicle sales, which in February unwound. In terms of the monthly inflation-adjusted bar and restaurant spending rates, these have contracted each month since a variety of consumer sentiment measures turned sour after the November elections (purple line in the above chart): -11%, -2.7% and -20.8% m/m AR starting in December.
However, policy uncertainty remains very elevated causing households to spend less than before, as a range consumer sentiment reports made clear recently. In particular, inflation-adjusted spending in bars & restaurants seem to suffer greatly from it. So, while I don't expect real consumption spending (real PCE) will contract further beyond January, its overall growth for Q1 will be a lot more muted that in H2 2024 and likely below trend.
March FOMC Meeting Preview
After the January FOMC meeting the Fed sort of took a backseat to await whether any clarity with regard to the Trump administration’s tariff policy would emerge. Alas, at the onset of the March FOMC meeting nobody (including the Fed) is any wiser with regards to the severity and scope of new tariffs, with elevated fiscal policy uncertainty adding to it. In the meantime, some data releases have begun to give stagflationary signals:
Household sentiment have been turning sour in particular regarding inflation expectations, which across the different firm and household survey started to noticeably drift up.
Given more downbeat sentiment, household spending growth became more muted, as discussed in the previous section.
Inflation, on the other hand, is on a more firming underlying trend with core PCE inflation likely to have accelerated in February, given a pickup in core goods inflation and sticky services inflation providing a high floor.
The labor market, for now, remains stable without reaching a historically high unemployment rate.
So, given recent trends in actual inflation, inflation expectations and the unemployment rate, how (un-)tenable is the current Fed funds rate level? To answer this question, we can look at rate prescriptions that result from various policy rate rules that relate the Fed funds rate to views about how much inflation deviates from 2% as well as views on whether the unemployment rate is "too low" or "too high". The various policy rate rules differ in their rate prescriptions, owing to
Different preferences to stabilize inflation vs stabilizing the unemployment rate.
What inflation measure you use: current inflation or more forward-looking measures.
Different long-run assumptions, in particular the neutral Fed funds rate level and the long-run unemployment rate.
How (im-)patient central bankers are in pushing the Fed funds rate to its "appropriate" target level.
By running the data through a variety of policy rate rule variants that differ along the lines outlined above and aggregating over the range of rate prescriptions1, you can get a pretty robust sense of the Fed funds rate level that is in-line with the current data.

The result from this policy rules exercise with data up to and inclusive of February are depicted in the chart above. From this chart it is clear that since December the Fed funds target rate has been pretty much aligned with underlying fundamentals given sticky inflation and a stabilizing unemployment rate.
In fact, the policy rule-based descriptions suggest that the fundamentals-based policy rate has troughed already. So, based on the chart above a decision to keep the Fed funds rate target unchanged at the March meeting seems appropriate, with most FOMC members corroborating this in their public remarks during the intermeeting period.
To gauge how restrictive the Fed’s interest rate policy is perceived to be for the year ahead, I published back in August 2023 an analysis that focused on a one-year survey-based real interest rate. This rate is calculated by taking the monthly average of daily one-year interest rates and subtracting the (monthly) common inflation expectations factor extracted from business and consumer surveys and scaled in year-on-year PCE inflation terms. Based on survey data going into February and March, this measure of ‘Main Street’ year-ahead inflation expectations accelerated throughout Q1 from 2.5% in January to 2.7% and 3.1% in February and March, respectively.

Key to assessing the restrictiveness of these one-year real rates is where neutral real rates are heading. The chart above is an update of an earlier chart and shows that after close to a decade of ultra-low neutral real rates, these rates have trended up since 2016. Going into February-March 2025, these R* estimates remained relatively stable with the average and median across the proxies sitting at around 1.4% and 1.3% respectively in January, above the median 1% rate from the Fed’s December SEP.

The chart above compares the one-year survey-based real interest rate with the R* range across the various market- and model measures as a perceived policy stance measure. It suggests that the Fed’s stance is expected to be somewhat accommodative in inflation-adjusted terms between now and February 2026 (around 45bps and 34bps below the average and median R*’s respectively) despite using higher R*’s compared to the Fed.
Some of this easing in perceived monetary policy stance came about through a declining one-year nominal rate between January and mid-March of around 20bps. Most of the expected stance easing, of course, is owing to the firming in near-term “Main Street” inflation expectations mentioned earlier, as these increased 20bps in February alone and, as of now, another 25bps in early March. Most Fed officials have expressed in public remarks their desire to keep rates on hold while assessing recent inflation trends and the uncertainty regarding new policy initiatives out of D.C., but with a lot of easing in the perceived monetary policy stance due to a pickup in inflation expectations will not be welcomed by some Fed officials:
“In determining how monetary policy should respond under different scenarios, especially those that might involve difficult employment and inflation trade-offs, it will be important that medium- to longer-term inflation expectations remain well anchored.”
A. G. Musalem, ‘Remarks on the Economic Outlook and Monetary Policy’, March 3, 2025

So, overall developments in the economy since the January meeting as well as a big emphasis on a cautious rate outlook in Fed officials’ statements likely means that the FOMC will keep its Fed funds target again unchanged in the 4.25%-4.5% range at its March meeting. This meeting will also see an update of the Summary of Economic Projections (SEP). I don’t think that the unemployment projections for 2025 and 2026 in table above will be revised. Growth for 2025, however, needs to be revised lower, as most nowcasts now point to a below-trend GDP print for Q1; I suspect the median 2025 GDP growth could very well drop to 1.8%-1.9% with the 2026 projection remaining unchanged.
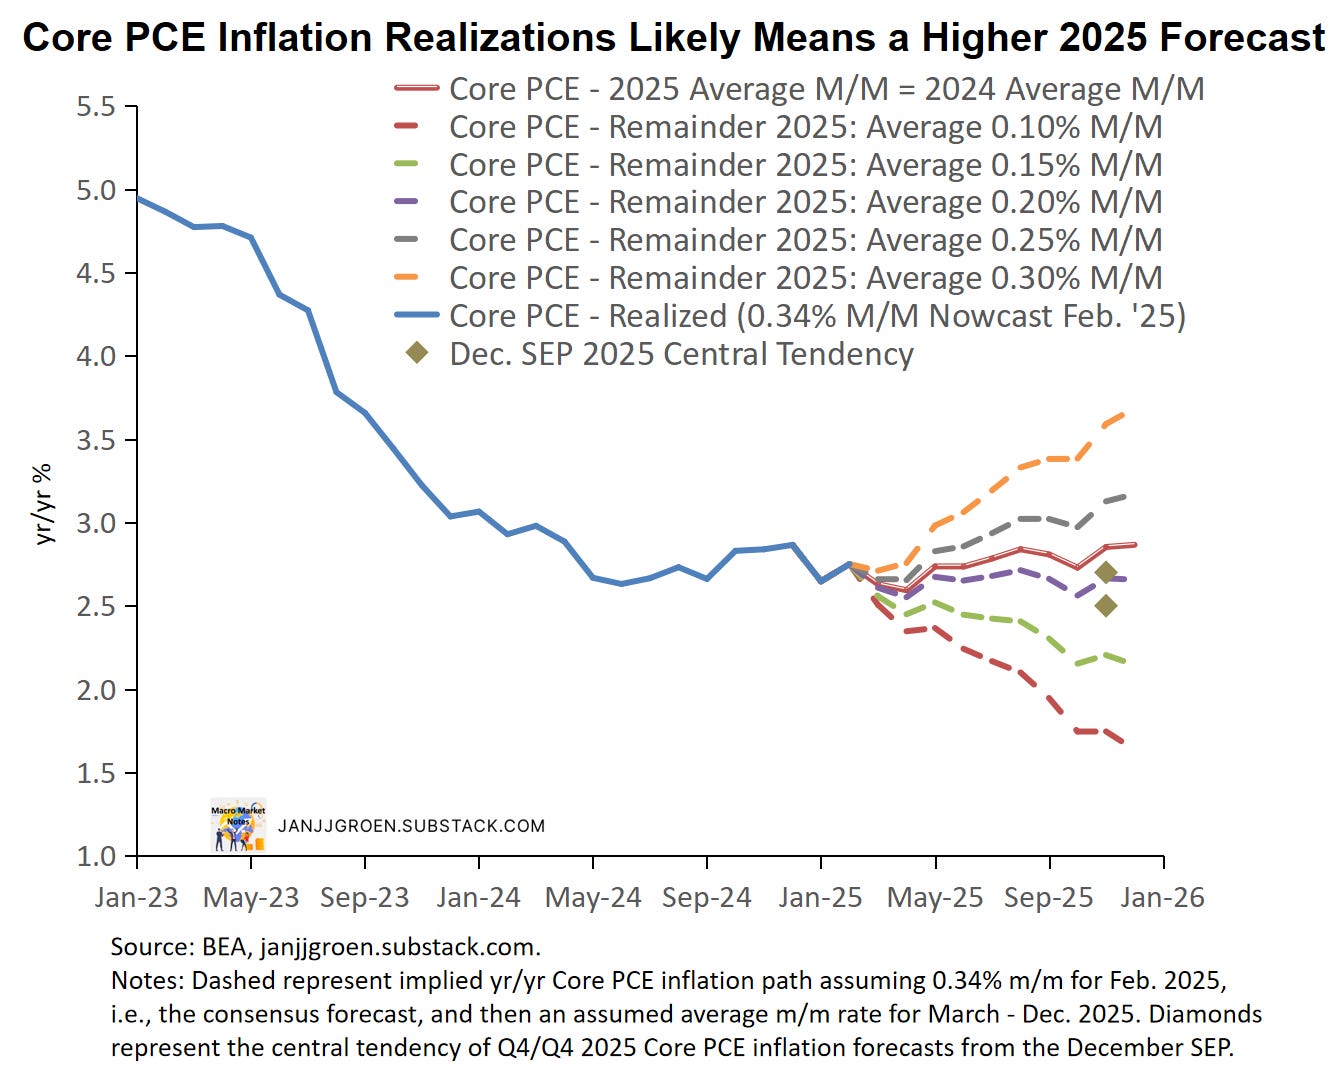
Based on the February CPI and PPI reports consensus expects February month/month core PCE inflation to come in at 0.34%, and acceleration from 0.28% in January (which in turn was firmer than December’s 0.21%). This would bring year/year core PCE inflation at 2.7%. With these prints the December SEP central tendency core PCE inflation projection of 2.5%-2.7% in 2025 would only be attainable if from now on until the end of 2025 the month/month core PCE inflation on average would be at most 0.2%, with 0.2% m/m suggesting a 2.6% core PCE Q4/Q4 rate (chart above). If, instead, the average m/m core PCE inflation rate for 2025 turns out to be the same as in 2024 (0.236%), we’ll have on average a 0.22% m/m rate for March-December resulting in a 2.8% core PCE inflation rate for 2025.
Given the likely forthcoming tariff hikes a 0.22% average m/m core PCE inflation rate for the rest of 2025 seems rather benign and could very be closer to a 0.25% average m/m rate (which suggests a 3.1% core PCE Q4/Q4 rate). The 2025 SEP core PCE inflation projection will therefore most likely be revised up from a median of 2.5% (see the above table) to likely 2.7%; the FOMC would still want to signal some inflation progress relative to 2024. Given this upgrade and a largely unrevised labor market outlook it seems unavoidable that the 2026 core PCE inflation projection would also need to be upgraded, likely to from 2.1% to 2.3%.
To summarize, in terms of the economic projections I expect the following updates to the SEP:
No material changes to the labor market outlook.
A downgrade in the 2025 GDP projection, from 2.1% to 1.9%.
Upgrades to the 2025 and 2026 core PCE inflation outlooks: from 2.5% to 2.7% in 2025 and from 2.1% to 2.3% in 2026.
Guidance regarding future policy rate changes will in my opinion not change much when the FOMC updates its SEP at the March meeting. As noted earlier, a variety market- and model-based still point to a higher R* than the Fed’s own view: 1.2%-1.4% vs 1%. I expect the Fed to continue to incrementally increase its long-run Fed funds rate level over the next couple of meetings, and in this SEP update I expect it to go from 3% to 3.1%.
With the one-year Treasury rate averaging at 4.06% over the first half of March, market pricing is broadly consistent with the projected two rate cuts in 2025 from the December SEP and I think the March SEP will continue to project two Fed funds rate cuts for 2025. As Chair Powell pointed out:
“Looking ahead, the new Administration is in the process of implementing significant policy changes in four distinct areas: trade, immigration, fiscal policy, and regulation. It is the net effect of these policy changes that will matter for the economy and for the path of monetary policy. While there have been recent developments in some of these areas, especially trade policy, uncertainty around the changes and their likely effects remains high. As we parse the incoming information, we are focused on separating the signal from the noise as the outlook evolves. We do not need to be in a hurry, and are well positioned to wait for greater clarity.“
J. H Powell, ‘Economic Outlook’, March 7, 2025
While the current ‘hard’ data, through the earlier discussed policy rules, indeed suggests the Fed funds rate is at a level where the Fed is “[…] well positioned to wait for greater clarity”, the fact that rising inflation expectations is seemingly making the Fed’s policy stance less restrictive should be notable. I expect the post-meeting remarks to put more emphasis on the role of inflation expectations in shaping the Fed’s response to new policy initiatives and the fallout to the rest of the economy. Continued firming of inflation expectations in response to the Trump administration’s policy actions would severely constrain the Fed’s room to maneuver in terms of its policy rate.
For more detail about the different policy rate rule variants that are used in this exercise, see the box at the end of my post-September FOMC post. The only difference compared to that note is that I now not only use the central tendencies for the long-run Fed fund and unemployment rates from the history of SEPs, but in addition also the maximum and minimum for these long-run values. This gives a more complete picture of how the distribution of beliefs evolved within the FOMC. As a result of this addition, the total number of policy rule variants from increases from 1200 to 3600.