


Jan. Personal Income & Outlays: A Cautious Consumer
Near-term trends in underlying inflation continue to rise with annual trends above 2%. Consumption growth slowed as wage incomes were downgraded.

The January Personal Income and Outlays report provides a good insight into the U.S. consumer as well as inflationary pressures going forward. This note presents some of these insights.
Key takeaways:
The central tendency measures of PCE inflation rose above 2.5% on a six-month basis. On a three-month basis these metrics continued to pick up the pace, and over an annual horizon the different underlying inflation rates stabilized in the 2.5%-2.6% range.
Personal income growth out of wages and salaries slowed in January and was downgrade for H2 2024. This meant that household wage income now apparently is growing more in line with the pace that’s consistent with 2% PCE inflation over the medium-term.
The stock of excess savings has NOT run out and continues to be a tailwind for consumption. Between December and January, it fell only around $7 billion, as elevated policy uncertainty is impacting households’ outlook, and equaled about $358 billion in January.
Headline consumption growth eased notably in January, back to its underlying spending growth pace. Towards the end of 2024 spending strength was concentrated in relatively few consumption categories, as the threat of tariffs likely caused household to pull forward spending in those categories. This pulled forward spending receded in January such that there should be no more additional pullback in the pipeline. The annual trend in spending remains solid, so one should not expect another dramatic downshift in consumption over the near term.
With unfavorable trends in underlying inflation the Fed will likely abstain from further rates cuts for quite a while. But with revised wage income growth now more in line with its inflation target, the prospect of a resumption in cuts later this year seems somewhat more likely than a month ago.
Medium Term Underlying Inflation Continues to Rise
Core PCE inflation accelerated in January to about a 3.4% annualized monthly rate from 2.5% in December (upwardly revised from 1.9%). Core goods inflation turned accelerated notably over the month at +5% annualized month/month compared to -3.3% in December (downwardly unrevised). Core service inflation slowed to 3% annualized month/month in January from an upwardly revised 4.5% in the preceding month.
The Fed’s favorite gauge of underlying inflation, core services excl. housing PCE inflation, slowed in a similar fashion as overall core services inflation, from (an upwardly revised) 4.7% annualized month/month in December to about 2.7%. Given the large volatility in this measure since the pandemic it is better to smooth through noisy month-over-month dynamics.
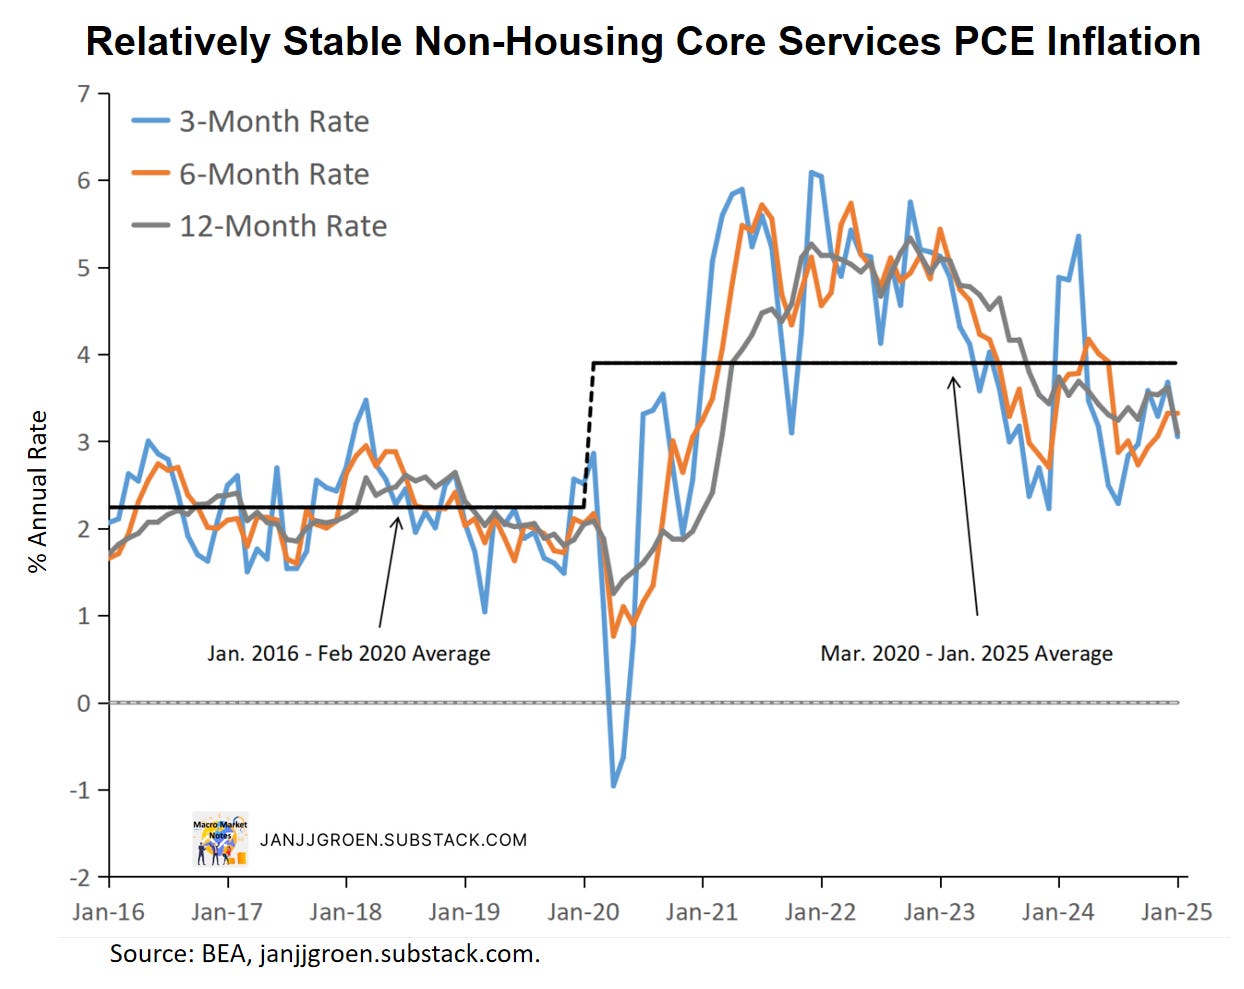
The chart above plots three-, six- and 12-month annualized inflation rates for the non-housing core services PCE deflator. The average annualized monthly rate reads about 3.9% for the post-COVID era (black dashed line), almost two times the average rate we observed for the immediate years pre-COVID.
Momentum in this non-housing core services inflation measure initially picked up in the fall with currently the three-month inflation rate remaining essentially stable around 3.1%. The twelve-month rate slowed as base effects kick in. It is unclear if there’s further disinflationary momentum in the pipeline, beyond the mechanical base effects, given stabilized three- and six-month rates.
Instead of focusing on whether specific components of inflation should be ignored or not when assessing underlying inflation trends, one could focus on the central tendency of consumer price inflation, a.k.a. the center of the distribution of all price changes unaffected by extremely volatile consumer price components. This could potentially provide a better sense of the target toward which inflation moves over time once those excessively volatile price changes have stabilized.
Such measures of central tendency for the PCE price indices use a variety of trimming procedures to weed out excessive volatile components of these price indices in a given month:
Median PCE, which takes the inflation rate of the component at the 50% percentile of the PCE component price changes.
Trimmed Mean PCE (Dallas Fed), where the highest 31% and lowest 24% of PCE component price changes are dropped.
15% Trimmed Mean PCE, where the highest 7.5% and lowest 7.5% of PCE component price changes are dropped.
20% Trimmed Mean PCE, where the highest 10% and lowest 10% of PCE component price changes are dropped.
30% Trimmed Mean PCE, where the highest 15% and lowest 15% of PCE component price changes are dropped.
To get a sense of near-term trends in underlying PCE inflation I look at six-month averages of the annualized percentage point deviation of the above monthly central tendency inflation measures relative to their values as implied by 2% core PCE inflation. This is also consistent with public statements by Fed officials that they’d like to see sustained progress of inflation converging back to target, as measured over months and quarters of inflation progress.
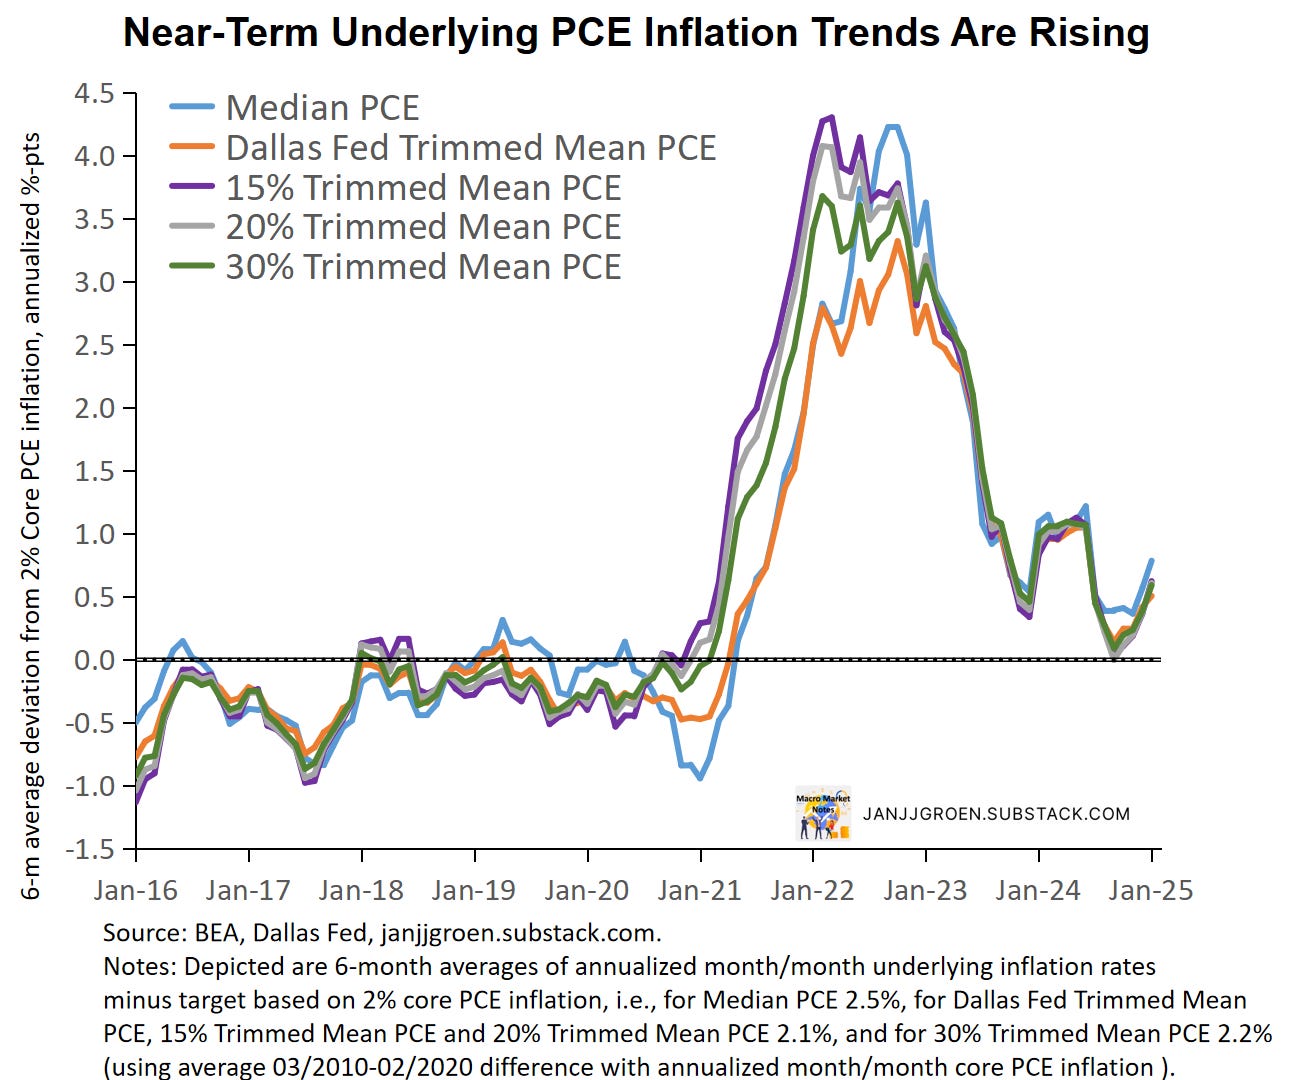
For most underlying PCE inflation rates six-month average deviations relative to the inflation target were at the Fed’s inflation target by September (chart above). Since then, these six-month measures have steadily been rising again, and in January they all are implying a six-month pace above 2.5% core PCE inflation. However, going forward, is this sustainable?

The chart above looks at three-month average deviations from 2% core PCE inflation across the underlying PCE inflation measures. Some measures (especially the 10%, 15% and 20% trimmed means) started to firm back in August and by September this trend had broadened out across all measures. Today’s report suggests that most recently these three-month averages (except the Dallas Fed measure) continued to pick up the pace above inflation target pace. So near-term trends are unlikely to come back towards the Fed’s inflation target anytime soon.

Over a somewhat longer horizon of a year the underlying inflation trends indicate that with base effects kicking in they are no longer rising further above the 2% inflation target. However, 12-month average deviations of underlying PCE inflation rates relative to the inflation target in the chart above do indicate stability above 2.5%. Current levels in the above chart suggests a longer-term core PCE inflation trend in the 2.5%-2.6% range. There’ll be no return to the inflation target in 2025.
Wage Income Growth Downgraded
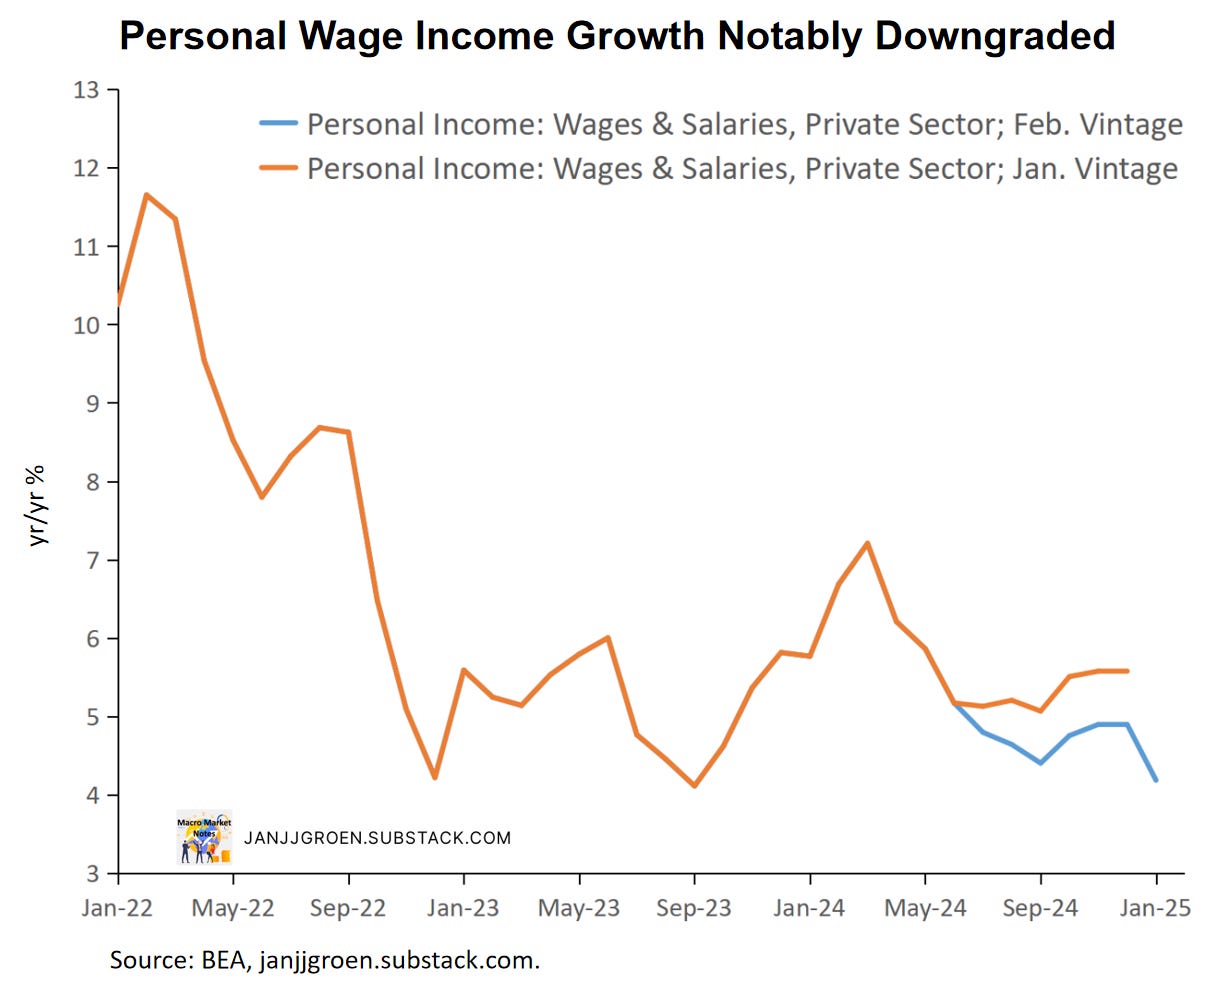
There were significant revisions to the recent path of household income out of wages and salaries in the January report, in particular for H2 2024 (chart above). The year/year wage income growth rate in January slowed to 4.2% from 4.9% in December (which was downwardly revised from 5.6%).
To interpret wage income growth trends, I earlier proposed to compare wage income growth with a neutral benchmark growth rate based on trend non-farm business sector (NFB) output growth and either the abovementioned common inflation expectations factor or the 2% Fed inflation target. Similar to what I did when discussing wages and inflation expectations in my October 2023 update, I now also incorporate trend labor share growth into this neutral benchmark.
Any deviation in actual household wage income growth above or below the aforementioned inflation target-consistent neutral benchmark means household wage income growth outpaces or cannot sustain in the medium term the 2% inflation target.

With downward revisions to wage income growth for H2 2024, the chart above shows that the wage income growth gap vs the 2% inflation target pace shrank significantly (orange vs. light blue lines). Using today’s data vintage, the slowing of the January household income growth out of private sector wages meant that current wage income growth is broadly consistent with 2% PCE inflation over the medium term.
Smoothing nominal wage income growth, the revisions in today’s report were good news for the Fed, as household spending growth appears to be less of an impediment to a sustainable return of inflation to 2% than initially thought.
Consumer spending declined 0.2% over the month in January, with disposable household income growing 0.9% for the same period. As a consequence, the savings rate increased to 4.6% in January compared to 3.4% previously (downwardly revised from 3.8%).
Over the month the savings rate converged back towards my trend savings rate estimate of 5% in January using the ‘average of trend’ approach outlined in my earlier excess savings note (orange line). This trend savings rate estimate increased modestly compared to December (4.9%, upwardly revised from 4.8% previously).
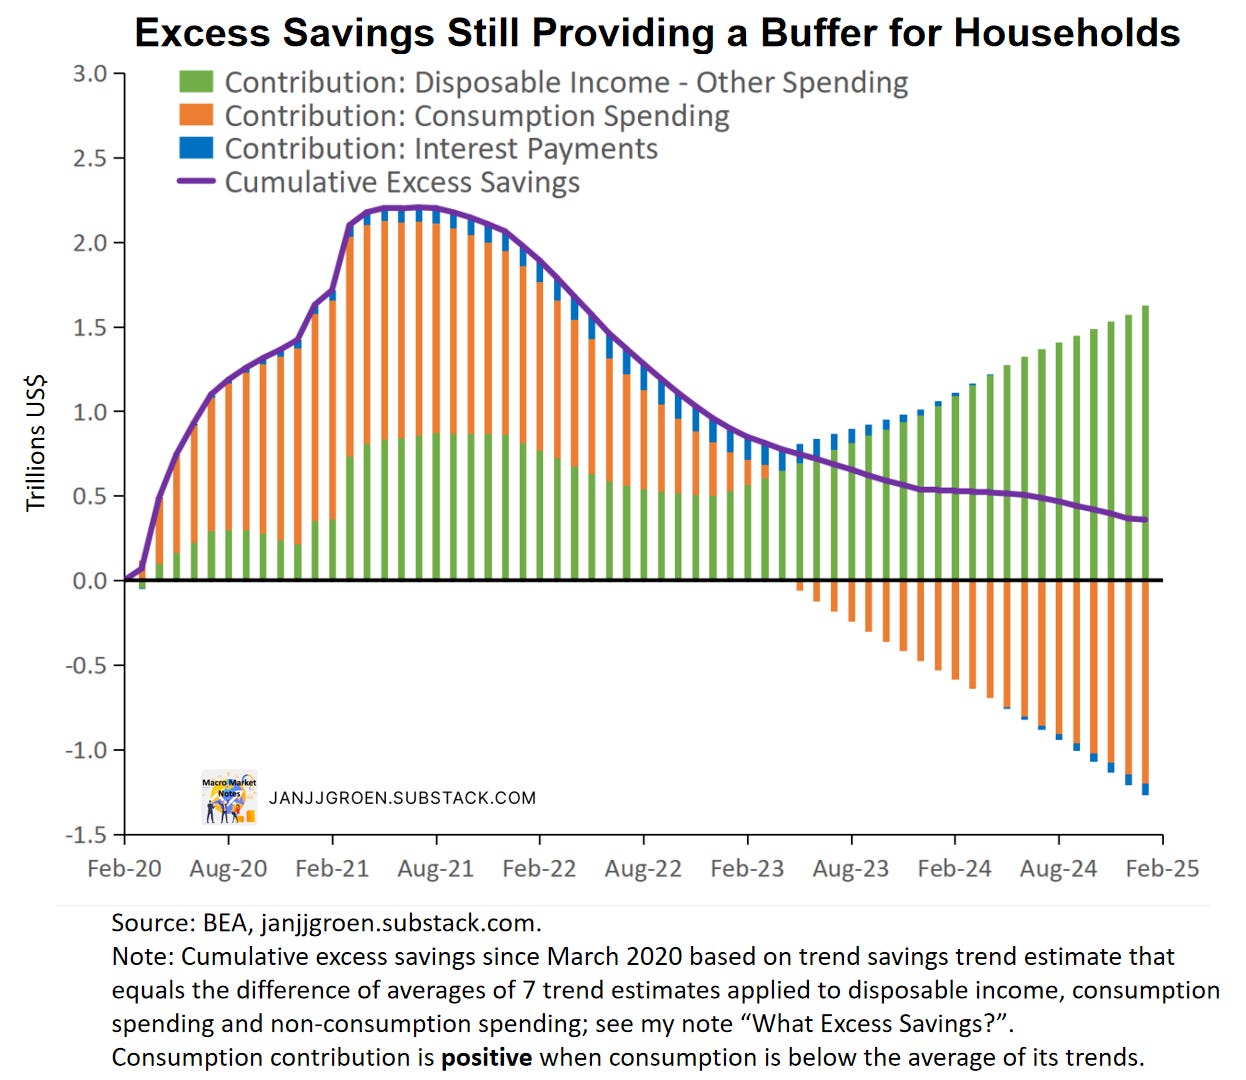
Using these estimate trend savings rates, the chart above shows that above-trend growth in disposable income continues to be a partial offset to the drawdowns in excess savings coming from above-trend growth in consumption spending and interest payments (green bars vs orange + blue bars). But with January spending slowing, as discussed above, in January cumulative excess savings declined only slightly from $365 billion in the previous month (revised up from $456 billion) to about $358 billion (see chart above). A lot of households (especially middle- and higher-income ones) continue to have access to a sizeable buffer to deal with shocks and higher-than-expected price increases and are willing to preserve these buffers.
Real Consumption Growth Remains Strong
As is the case with headline inflation, headline real consumption spending growth often is driven by volatile components that not always reflect the underlying strength of the economy. A core, or underlying, real consumption spending growth measure, therefore, would be really useful, and I do that by approximating such a core measure based on the weighted median across 177 components1 of headline real personal consumption expenditures (PCE). More specifically, the underlying consumption growth measure equals the growth rate of the real PCE component at the 50% percentile across growth rates of these 177 sub-components of headline real PCE.

The chart above focuses on three-month annualized consumption growth rates. Real consumption spending slowed significantly to 2% in January compared to 4.7% in December (upwardly revised from 4.4%). While December three-month consumption spending growth well overshot the corresponding median rate, in January it converged back to the underlying pace. This suggests that strong December spending mainly was concentrated in a relatively few categories, which got paired back going into 2025.
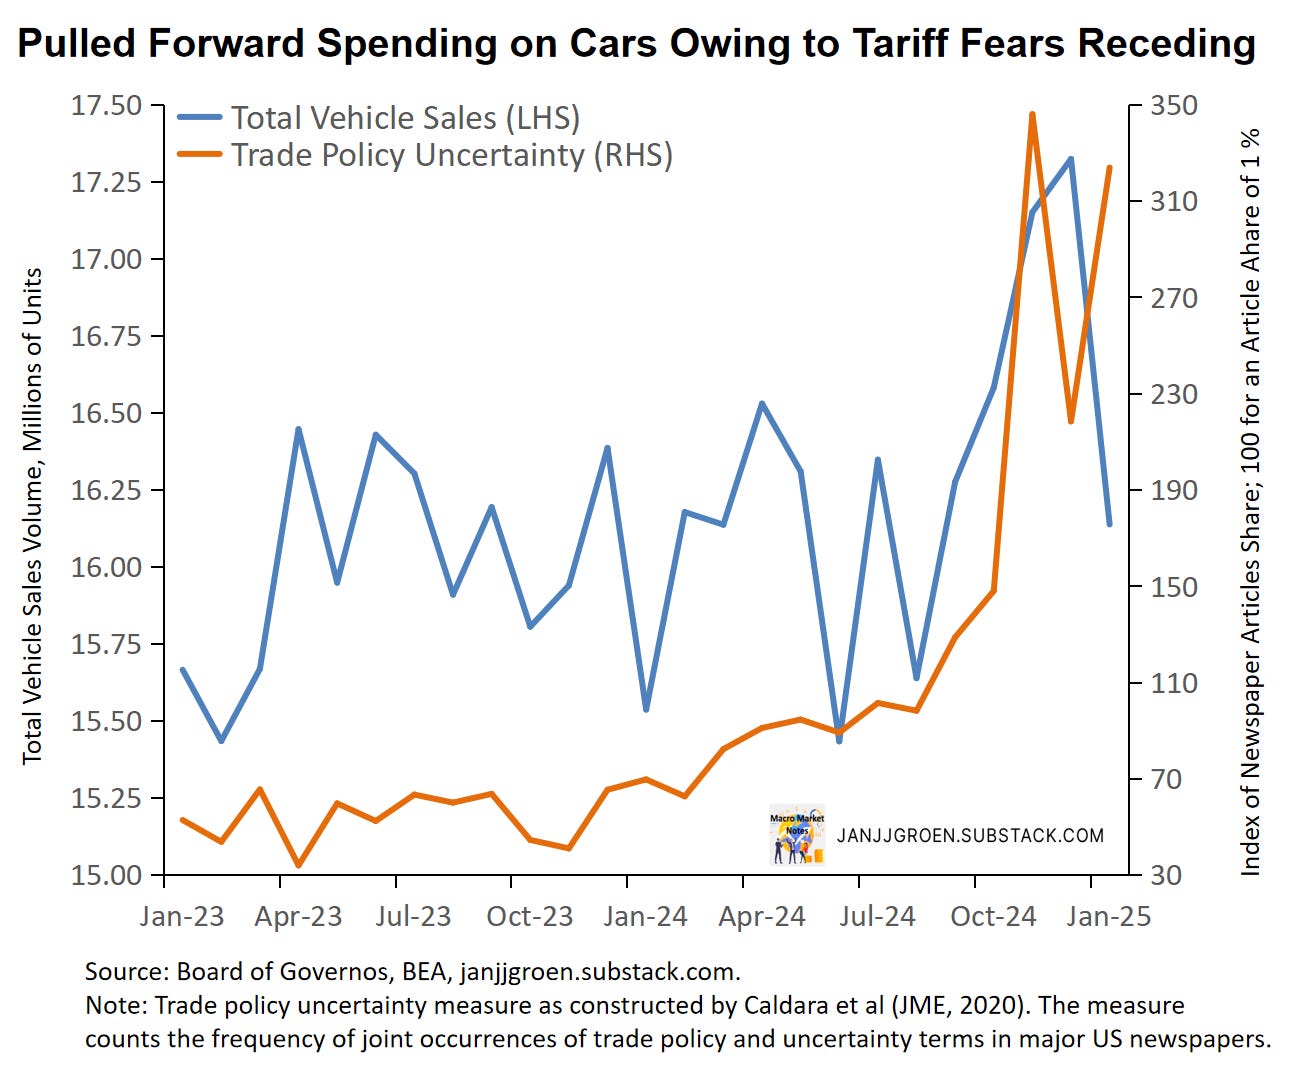
When discussing the December PCE report I noted in particular real car sales were strong in December, likely caused by growing fears that forthcoming tariff hikes could make items like cars notably more expensive and incentivizing households to pull forward these purchases. Indeed, comparing car sales volumes with a measure of trade policy uncertainty (based on Caldera et al. (JME, 2020)) suggests that was the case (chart above). Pulling forward spending on durable goods (like cars) only can last a limited time, however, given the price tickets and the long usages of these items. spending. This is what seems to have happened in January with car sales volumes dropping back to levels that prevailed before the rise in trade uncertainty.
But policy uncertainty, and trade policy uncertainty in particular, remained high in January and with households having to spend on pulled forward large ticket purchases it’s not surprising that households stepped back from spending and increased their savings as a precaution for more uncertain times. Of course, it didn’t help that wage income growth slowed as well in January.
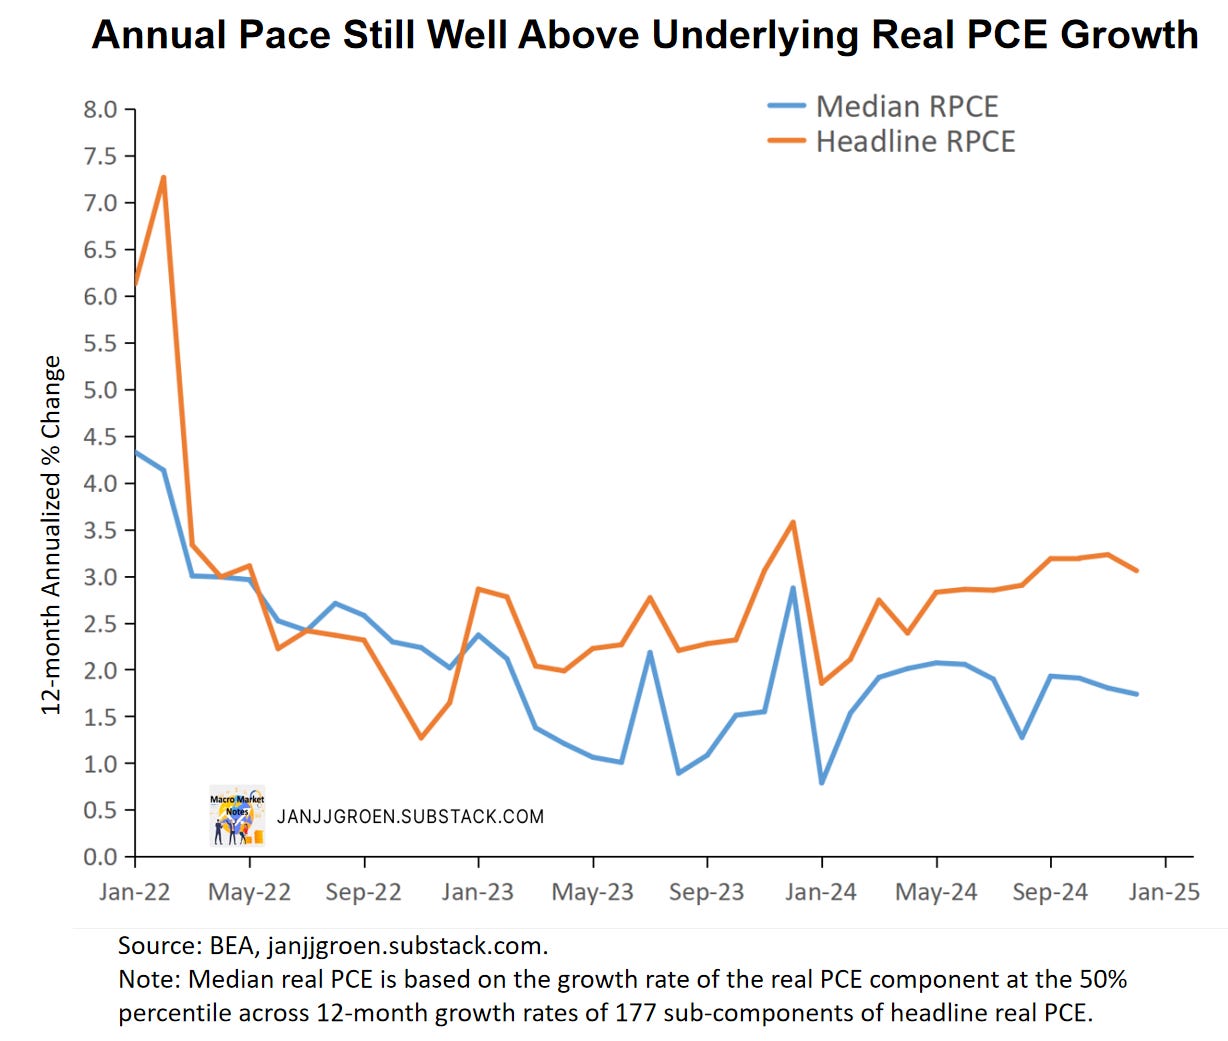
The minor discrepancy between headline and median consumption growth on a three-month basis in January suggests that there shouldn’t be much more downward future correction in the pipeline for consumption growth. Indeed, as the chart above shows, on an annual basis headline still runs well above the median growth rate, with the latter remaining broadly stable since September. So as long as wage income growth remains solid, still healthy balance sheets and unspent accumulated excess pandemic savings should keep consumption growth from slowing too much.
Given the firming in underlying inflation rates the Fed will remain very cautious easing rates further in 2025. The apparent slowing in wage income growth closer to the medium-term inflation target pace should give the Fed comfort that at some point this year rate cuts could resume again. The slower medium-term wage income growth rate could very well bring spending growth back to more appropriate slower rates. However, many uncertainties remain, including uncertainty in how much spending and income in this report were impacted by temporary factors.
For a description of these 177 components, see Appendix A in the Dallas Fed trimmed mean PCE inflation working paper, where I use the corresponding real quantities instead of the price indices.