


Nov CPI, Jobless Claims Trends and Dec FOMC Preview
Core inflation was firmer in November, but underlying trends were mixed. Claims rose for 2 weeks in a row. The Fed will cut but signal caution for 2025.

This post reviews trends from some of the most notable data releases this week: the November CPI and the weekly jobless claims data. I’ll also preview the upcoming December FOMC meeting.
Key takeaways:
Core CPI inflation was again firm in November and trimmed mean CPI measures suggest that in terms of underlying PCE inflation disinflationary trends have bottomed out.
The recent jobless claims data continue to point to a lukewarm labor market through early December, with somewhat elevated layoffs and tepid hiring.
At the upcoming December FOMC meeting another 25bps rate cut is certain. In the accompanying economic projections update, revisions will reflect a more elevated inflation pace for 2025 than previously expected as well as a more favorable outlook on the labor market. Consequently, the expected number of rate cuts for 2025 will likely be dialed down from four to three 25bps cuts, reflecting the ongoing easing bias within the Fed.
November CPI: Standing Pat
The topline numbers of the November CPI report came broadly in line with consensus expectations. Headline CPI increased 0.3% over the month in November after rising 0.2% in October, whereas core CPI inflation was up 0.3% month/month (three-digits: +0.308% compared to +0.280% in October).
To get a feel of underlying CPI inflation, one can look at the Cleveland Fed's trimmed mean CPI measures, which cast away excess volatile elements by either taking the median (price change of the CPI component at the 50th percentile across all price changes) or a 16% trimmed mean (weighted average of price changes once both the top 8th percentile and lowest 8th percentile of price changes are deleted). The Median CPI inflation measure eased slightly from +0.30% month/month to +0.23% in November, whereas the 16% Trimmed Mean CPI inflation showed a similar pace as last month: +0.27% month/month. So, as was the case for the previous report, the trimmed mean inflation measures (a.k.a. underlying inflation) appeared slightly less sticky over the month than was implied by core CPI inflation.
As usual a big driver behind CPI inflation dynamics remained the CPI Rent of Shelter component (OER+Rent), which eased somewhat in November relative to October: from +0.4% month/month to 0.3%. CPI OER inflation has been volatile across regions during the summer, with unusual strong CPI OER in the Northeast in May and weakness in June in the West. Between October and November, however, three out of the four Census regions showed a slower month/month OER inflation rate (the West was the exception). Note, though, that while housing services drives about 40% of core CPI inflation, it determines less than 20% of core PCE inflation, the Fed's preferred inflation measure. Disinflation therefore needs to be more broad-based and the trimmed mean CPI inflation metrics currently are inconclusive on that issue.

Median CPI inflation in the chart above is still overshooting the Fed's 2% inflation target over a six-month period and this didn't change over the month. However, the six-month averaged 16% Trimmed Mean CPI inflation measure increased and moved further above the target.
When using the strong correlation between the CPI and PCE trimmed mean inflation series, statistical nowcasts of Median and Trimmed Mean PCE inflation (due later this month) suggest near-term underlying PCE inflation trend measures, like in October, went up in November but still remained below 2.5% (diamonds in the chart above). The nowcasts of underlying PCE inflation dynamics signal that the disinflation trend has bottomed out, although the near-term trend is still consistent with the Fed’s inflation target.
Jobless Claims Continue to Rise
Initial jobless claims for the week ending Dec 7th rose for the second consecutive week to 242k (vs. 225k upwardly revised for the preceding week). Continued claims (people claiming unemployment benefits for more than 1 week) for the week ending Nov. 30th also rose, to 1886k from 1871k previously. The 4-week average for this measure stood at 1888k, the highest since Nov. 27th, 2021.
In terms of the unemployment outlook, initial claims are usually considered as a high frequency, real-time indicator of layoffs. What is relevant in that context is whether the layoff rate as implied by initial claims is significantly high or low to put substantial upward or downward pressure on the unemployment rate. To assess this, I laid out earlier a methodology to determine a benchmark rate for initial claims for the current month based on three elements: (i) net hiring (excl. layoffs), (ii) breakeven pace of payrolls given current unemployment rate, labor force participation rate and population growth, and (iii) the ratio of laid off persons filing for unemployment benefits. This benchmark rate equals the maximum number of initial claimants that will keep the unemployment rate constant relative to the previous month. If current initial claims rise above this claims benchmark rate, initial claims could potentially start to add to the unemployment rate.

The chart above compares (seasonally adjusted) initial jobless claims and its four-week moving average with the claims benchmark rate based entirely on BLS data (orange line) as well as a claims benchmark rate that instead incorporates the CBO’s more aggressive population projections for 2023 and 2024 (purple line). The more aggressive population growth projections clearly have lowered the benchmark rate for claims this year (orange vs. purple lines in the chart above). Furthermore, with the publication of the October JOLTS report last week, the net hiring component of these claims benchmark rates (hiring minus quits and retirements) got revised down as hiring rates eased and quits rates went up.
With the earlier discussed rise over the week initial claims have now, for the first time since the week ending Oct. 12th, risen above the CBO-adjusted benchmark rate and approached the other benchmark rate (chart above). This suggests that last week's initial jobless claims exerted some upward pressure on the unemployment rate for Dec. The 4-week claims average, however, remains below both claim benchmark rates.
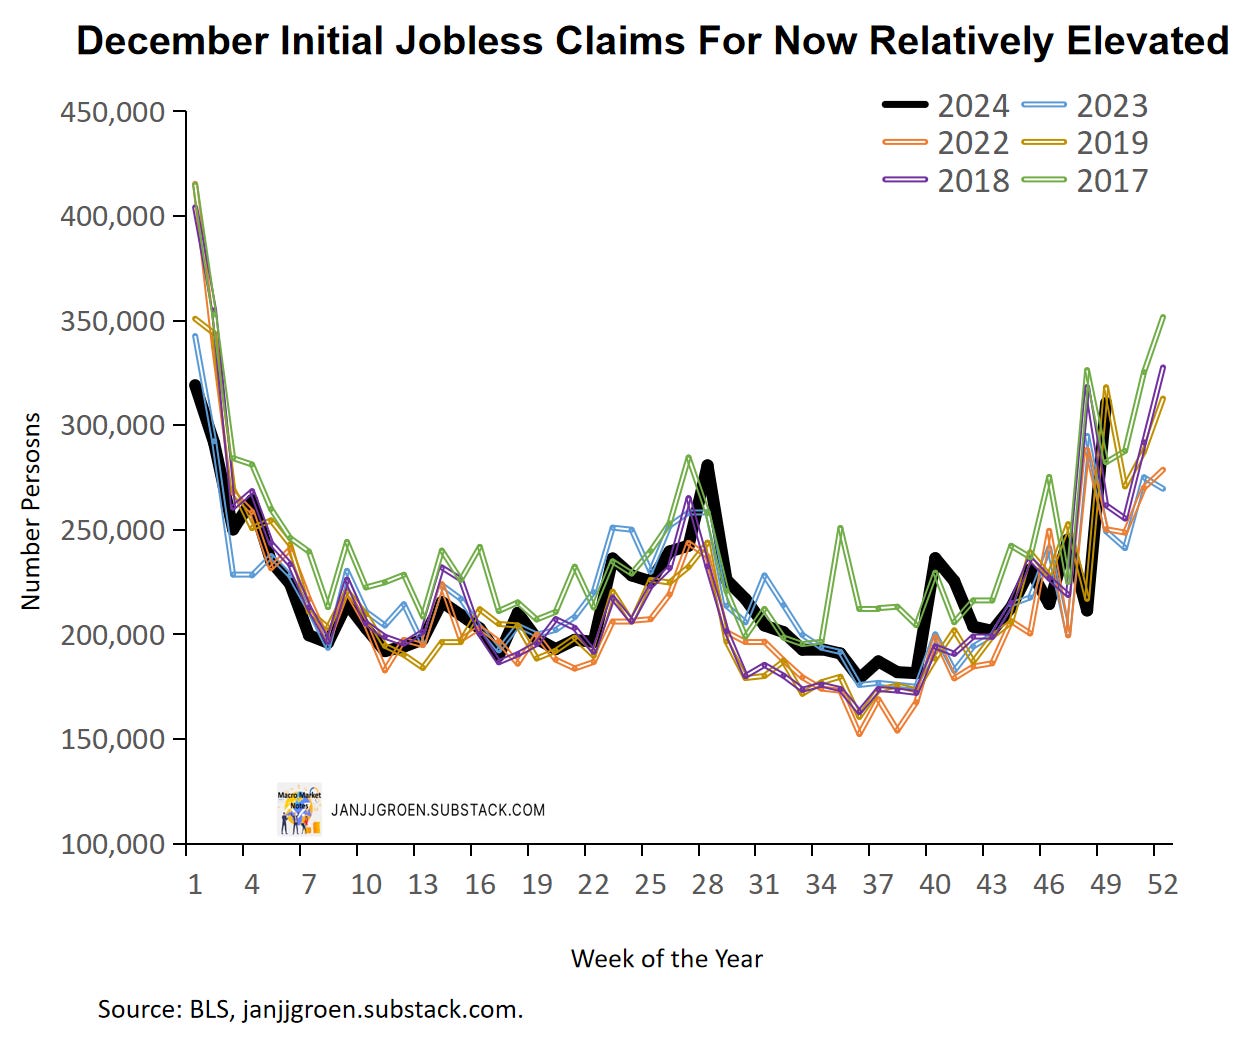
Seasonally adjusting weekly data is always a delicate matter, so some of the above discussed rise in initial claims could be due to seasonal adjustment distortions. The chart above compares non-seasonally adjusted initial claims data for each week this year with previous years. Compared to previous years, current non-adjusted initial claims are at the top of the range in line with 2019. So seasonal adjustment distortion explains SOME of the initial claims rise but not all.
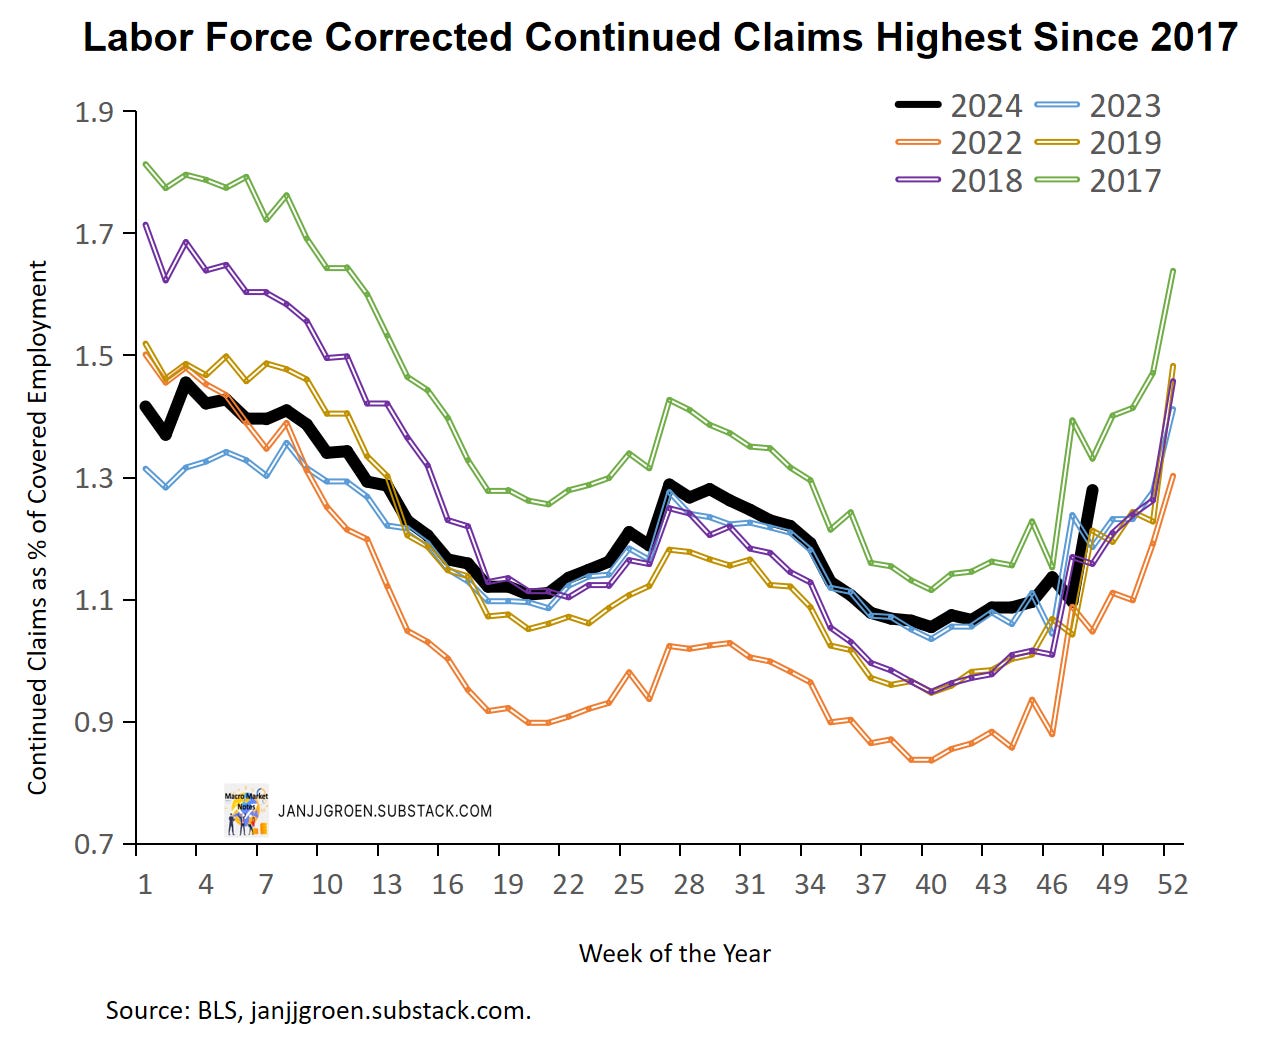
Furthermore, when we look at non-seasonally adjusted continued claims as a percentage of insured employment in the chart above, we notice that up to now in December these are running higher compared to most of the recent years except 2017 (when the Dec. unemployment rate equaled 4.1%). Clearly, hiring, for now, is not picking up meaningfully in December. The recent jobless claims data shows that through early December the labor market remained as lukewarm as it was in November, with a somewhat elevated rate of layoffs and a tepid hiring rate.
December FOMC Meeting Preview
After the September FOMC meeting, Chair Powell made it clear that sustained disinflation as well as labor market warranted a recalibration of the Fed’s policy stance acknowledging that the balance of risks had become two-sided. In other words, by August inflation and the unemployment rate had evolved such that the Fed funds rate was deemed to be too restrictive relative to the economy’s fundamentals.
But by how much was the Fed funds rate supposedly ‘too restrictive’? To answer this question, we can look at rate prescriptions that result from various policy rate rules that relate the Fed funds rate to views about how much inflation deviates from 2% as well as views on whether the unemployment rate is "too low" or "too high". The various policy rate rules differ in their rate prescriptions, owing to
Different preferences to stabilize inflation vs stabilizing the unemployment rate.
What inflation measure you use: current inflation or more forward-looking measures.
Different long-run assumptions, in particular the neutral Fed funds rate level and the long-run unemployment rate.
How (im-)patient central bankers are in pushing the Fed funds rate to its "appropriate" target level.
By running the data through a variety of policy rate rule variants that differ along the lines outlined above and aggregating over the range of rate prescriptions1, you can get a pretty robust sense of the Fed funds rate level that is in-line with the data.

The numbers resulting from this policy rules exercise with data up to and inclusive of November are depicted in the chart above. From this chart is clear that in the run up to the September FOMC meeting, the Fed funds rate was about 100bps above the fundamentals-based level. The Fed started off its recalibration with a bang by cutting the Fed funds rate target by 50bps. In my opinion this was mostly fueled by a fear amongst FOMC members that the pace of both disinflation and labor market cooling could pick over the remainder of the year, where the Fed funds rate recalibration potentially could not be achieved in a timely manner.
However, as both monthly core inflation and the unemployment rate essentially moving sideways since September it gave the Fed the opportunity to conduct a timely catch down of its policy rate with fundamentals. The chart above suggests a further 25bps rate cut at the December meeting would complete the Fed funds rate recalibration exercise. A 25bps rate cut at the December FOMC meeting is therefore a given, in my opinion, with most FOMC members corroborating this in their public remarks during the intermeeting period.
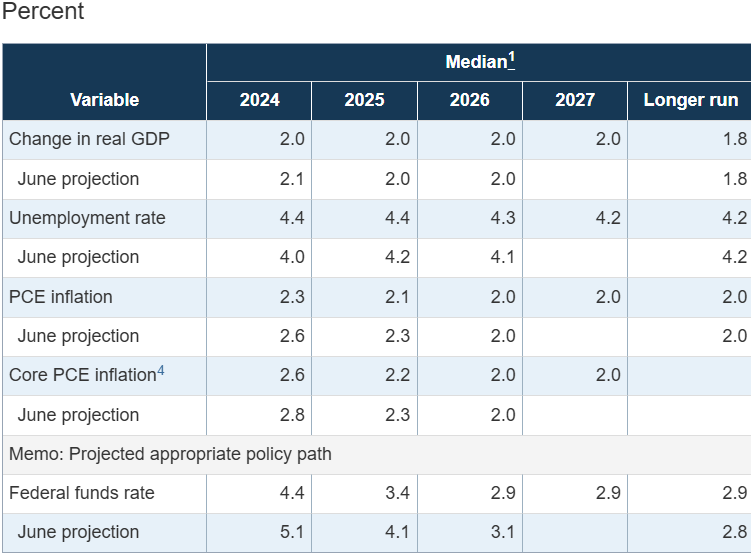
More interesting will be the update to the Summary of Economic Projections at the December meeting. Quite a few updates are expected, not the least of which will be related the economic activity projections. Firstly, the September projection of 4.4% Q4 2024 unemployment rate (SEP table above) is too high with the November unemployment rate sitting at 4.2%.

Similarly, based on the November CPI (discussed earlier) and PPI reports consensus expects November year/year core PCE inflation to come in at 2.8%. Even if we have a month/month core PCE inflation rate of 0.1% in December that would still keep the 2024 Q4/Q4 core PCE inflation rate at around 2.8%, above the September forecast of 2.6% (SEP table above). And even the September SEP projection of 2.2% in 2025 would only be attainable if from now on until the end of 2025 the month/month core PCE inflation on average would be LESS than 0.2%. Indeed, after updating the bulk of near-term inflation expectations from firm and consumer surveys for November, the common trend across these survey-based measures suggests an expectation for 2.5% inflation in PCE inflation terms for November 2025 (chart above).
With, as discussed in the two previous sections, underlying inflation providing mixed signals and the labor market remaining lukewarm, I expect the following key changes to the economic projections:
The 2024 unemployment rate forecast will be downwardly revised from 4.4% to 4.2%, whereas the 2025 projection will be downgraded from 4.4% to 4.3%.
For 2024, core PCE inflation will see an upward revision to its forecast from 2.6% to 2.8%. For 2025 the forecast will move up from 2.2% to 2.3%.

Guidance regarding future policy rate changes will in my opinion be less straightforward than what most are expecting. The chart above incorporates updates from a range of neutral real rates I used earlier, and these still point to a higher level than what was penciled in within the September SEP: 1.2%-1.4% (chart above) vs. 0.9% (SEP table above). Most Fed officials have signaled that it is likely R* has increased, either due to strong consumption spending (Barking, Powell), elevated fiscal spending (Collins, Waller) or global demand for U.S. assets (Logan). Nonetheless, most have also cautioned against overreacting to theoretical models and instead advocated for gradual adjustments. I therefore expect only a minor upgrade in the long-run Fed funds rate projection from 2.9% in September to 3%.
Additionally, the chart above shows the one-year survey-based real interest rate as a perceived policy stance measure, which is calculated by taking the monthly average of daily one-year interest rates and subtracting the (monthly) common inflation expectations factor (scaled in PCE terms) from the inflation expectations chart discussed earlier. Comparing it with the R* range for the most recent data suggests that over a one-year horizon there’s an expectation the Fed’s stance will remain restrictive in inflation-adjusted terms between now and December 2025 (around 30bps-50bps above the R*’s) despite using higher R*’s compared to the Fed.
The above is reflective of a one-year nominal rate that going into the December meeting sits at around 4.2%, which after a December rate cut suggest we only will get one cut next year. More precisely this likely suggests that the market expects two more rate cuts in 2025 with a notable tail risk that only one will materialize. While this may very well be a realistic outlook given recent economic strength, stickier-than-expected inflation and heightened policy uncertainty coming out of D.C., it certainly is reflective of my outlook, I sincerely doubt that this is the message the Fed wants to convey after its December meeting.
During the intermeeting period Fed officials noted the increased likelihood of stickier inflation but also clearly acknowledged substantial realized progress in reducing inflation. Moreover, most officials highlighted the need to balance between sustaining disinflation and supporting a stable labor market. Overall, there seems to be a broad consensus to keep the easing cycle ongoing:
“Caution is warranted, but substantial progress allows room for adjustment.”
Logan, L, “Navigating in shallow waters: Monetary policy strategy in a better-balanced economy “, November 13, 2024.
“The Fed will be deliberate but supportive of the economic expansion.”
Powell, J.H., “Economic Outlook “, November 14, 2024.
“Gradual and thoughtful adjustments are key to sustaining economic health.”
Williams, J.C., “The Journey”, December 2, 2024.
“Inflation could pause cuts, but the trajectory remains accommodative overall.”
Waller, C.J., “Cut or Skip? “, December 2, 2024
While recent inflation data did provide mixed messages on the potential of further disinflation, the overall tone of Fed officials’ remarks suggests this is seen as a constraint on policy easing as opposed to a stop signal. Most FOMC members seem comfortable proceeding with cuts unless inflation deviates significantly from their expectations.
Combine this with the, by now usual, emphasis on data dependence with a focus on gradualism, flexibility, and economic resilience, and it is likely that the number of projected rate cuts for 2025 in the updated SEP will be dialed down with only one cut, from four 25bps rate cuts to a Fed funds rate of 3.4% by Q4 2025 in the September SEP (see SEP table above) to three 25bps rate cuts resulting in a Fed funds rate in line with a 3.5%-3.75% target range by Q4 2025 in the new SEP. For better or for worse, the forthcoming rate cut decision will reflect a “neutral rate cut” rather than the “hawkish rate cut” that most analysts and market participants seem to be expecting. Especially given the still unfolding post-election policy uncertainty, the March or June FOMC meeting will, from the point of view of Fed officials, be more appropriate venues to deliver such a “hawkish rate cut”, if needed.
For more detail about the different policy rate rule variants that are used in this exercise, see the box at the end of my post-September FOMC post. The only difference compared to that note is that I now not only use the central tendencies for the long-run Fed fund and unemployment rates from the history of SEPs, but in addition also the maximum and minimum for these long-run values. This gives a more complete picture of how the distribution of beliefs evolved within the FOMC. As a result of this addition, the total number of policy rule variants from increases from 1200 to 3600.