


May Retail Sales and June FOMC Preview
May real retail sales on goods excl. gas and autos bounced back, but real bar/restaurant spending contracted. The Fed will likely stay on hold.

This post reviews the May retail sales report and I’ll also preview the upcoming June FOMC meeting.
Key takeaways:
Inflation-adjusted retail sales were solid over the month for core goods excl. motor vehicles in May and have been recovering on a three-month basis. Real bar/restaurant spending has been slowing over the past two months.
At the upcoming June FOMC meeting it is very likely that policy rates remain on hold for the second consecutive month. In the accompanying economic projections update, revisions will be relatively modest. The expected number of rate cuts for 2025 will likely remain unchanged at two 25bps cuts. With ongoing policy uncertainty and near-term inflation expectations remaining elevated, post-meeting remarks will likely continue to emphasize the role of inflation expectations.
May Retail Sales: A Mixed Bag
Retail sales for goods contracted 0.9% month/month in May compared to a 0.2% decline previously. When interpreting retail sales data, it’s essential to look deeper:
Retail sales measures spending on goods as well as bar/restaurants spending. Thus, it really mostly measures goods consumption which is a relatively small slice of the monthly consumption basket, as about 2/3 of U.S. consumption expenditures relates to services.
Retail sales data does not correct for changes in prices, which for goods in particular can make a big impact. As such stronger retail sales growth, for example, could merely reflect more the pace of price increases while retail sales volumes were less benign.
Deflating retail sales with CPI or core CPI overlooks the predominantly goods-focused nature of retail spending.
Dissecting retail trade data into subcomponents and aligning them with corresponding CPI subcomponents provides a more accurate assessment. Firstly, when it comes to retail trade data (that is, retail sales minus nominal bar and restaurant spending) I use the CPI Commodities, CPI Gasoline, CPI New & Used Vehicles and CPI Motor Vehicle Parts & Equipment indices to inflation adjust over retail trade as well as components related to sales at gasoline stations and motor vehicle dealers & parts. In case of bar and restaurant spending I deflate that component by means of the CPI Food Away from Home index.
Furthermore, I apply chain-weighting based on the Fisher index approach using current period and previous period prices and quantities of retail trade and the gas and motor vehicle components to parse out the impact of the latter two volatile components. This approach allows for time-varying weights, as prices and quantities change from period to period and consumers substitute between the different spending categories. It is the same methodology used by the BEA to compute real consumption and GDP.
Real core goods spending (inflation-adjusted retail sales excl. gas stations) slowed in May to +2.2% annualized three-month basis from 6% in April, as is evident from the chart above. Real core goods sales excluding motor vehicles, however, accelerated to a +0.8% three-month AR pace, after recording -1.8% in April (orange line in the chart above). Finally, inflation-adjusted bar and restaurant spending decelerated to 5.3% 3-month AR in inflation-adjusted terms in May from 6.9% previously (purple line in the chart above).
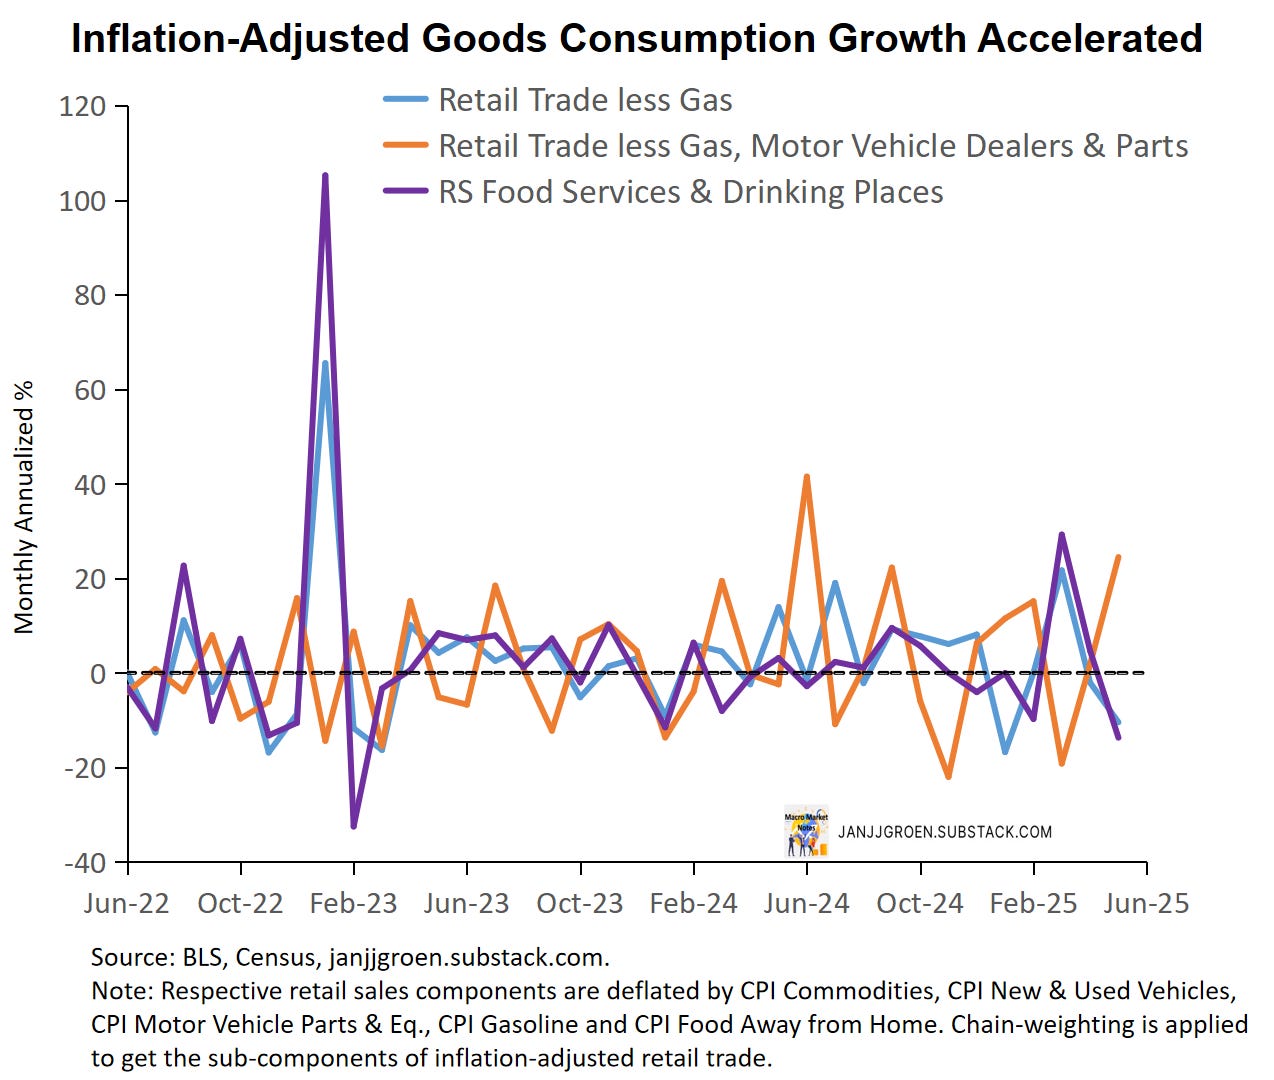
The chart above indicates that over the month the patterns in real retail spending shifted in a bit more dramatic fashion. Real goods sales excl. gas stations declined more in May than in April: from -2.1% to -10.4% AR (blue line). Compare this with the monthly rates of real core goods spending excl. motor vehicles (orange line), which re-accelerated in April and May (+1.8% and 24.5% month/month AR respectively vs -19.2% in March). So, the worsening pullback in real goods spending in May was mainly due to a more severe inflation-adjusted contraction in motor vehicle sales compared to April. Indeed, real auto dealer sales dropped by -35.5% AR vs -7% in April. Monthly inflation-adjusted bar and restaurant spending declined by -13.7% AR in May after increasing +4.7% and +29.3% in April and March, respectively (purple line in the above chart).
So, what could this mean for the May real PCE (due later this month)? For real PCE, real retail trade excl. gas stations and motor vehicles & parts as well as real bar & restaurant spending are the most relevant. With the former rebounding over the past two months whereas the latter going in the opposite direction, the outlook for May real PCE based on the May retail sales report is a mixed bag. Don’t expect a blowout report for May real PCE next week.
June FOMC Meeting Preview
At the May FOMC meeting the Fed gave a strong signal that policy uncertainty was too elevated for the Fed to start moving on its policy rate and a still resilient labor market allowed it to be patient. Both in terms of tariff as well as fiscal policy uncertainty remains elevated. And in term of the inflationary impact of tariffs we barely at the start of seeing this materializing as firms built up inventories in anticipation of tariff hikes while the effective tariff rate is not yet fully reflective of the announced tariff measures. Furthermore, the recent intensification of the Israel-Iran conflict sent global oil prices soaring, and the longer this persists the more likely this will be an additional source of upward pressure on inflation and inflation expectations.
In the meantime, some data releases have begun signaling a real activity slowing:
Household spending growth became more muted in relation to “big ticket item” purchases (such as cars) and leisure services, as discussed in the previous section. Wage income growth for households, however, rebounded notably.
Inflation has been slowing in recent month, but an above-2% underlying trend remains firmly in place: with underlying PCE inflation trends hovering around 2.7% in core PCE terms.
The labor market is cooling gradually with the unemployment rate likely to drift up to 4.3% over the near term.
So, given recent trends in actual inflation, inflation expectations and the unemployment rate, how (un-)tenable is the current Fed funds rate level? To answer this question, we can look at rate prescriptions that result from various policy rate rules that relate the Fed funds rate to views about how much inflation deviates from 2% as well as views on whether the unemployment rate is "too low" or "too high". The various policy rate rules differ in their rate prescriptions, owing to
Different preferences to stabilize inflation vs stabilizing the unemployment rate.
What inflation measure you use: current inflation or more forward-looking measures.
Different long-run assumptions, in particular the neutral Fed funds rate level and the long-run unemployment rate.
How (im-)patient central bankers are in pushing the Fed funds rate to its "appropriate" target level.
By running the data through a variety of policy rate rule variants that differ along the lines outlined above and aggregating over the range of rate prescriptions1, you can get a pretty robust sense of the Fed funds rate level that is in-line with the current data.

The result from this policy rules exercise with data up to and inclusive of May are depicted in the chart above. From this chart it is clear that since December the Fed funds target rate has been pretty much aligned with underlying fundamentals given sticky inflation and a relatively stable unemployment rate.
So, based on the chart above a decision to keep the Fed funds rate target unchanged at the June meeting seems appropriate, with most FOMC members corroborating this in their public remarks during the intermeeting period.
To gauge how restrictive the Fed’s interest rate policy is perceived to be for the year ahead, I published back in August 2023 an analysis that focused on a one-year survey-based real interest rate. This rate is calculated by taking the monthly average of daily one-year interest rates and subtracting the (monthly) common inflation expectations factor extracted from business and consumer surveys and scaled in year-on-year PCE inflation terms.
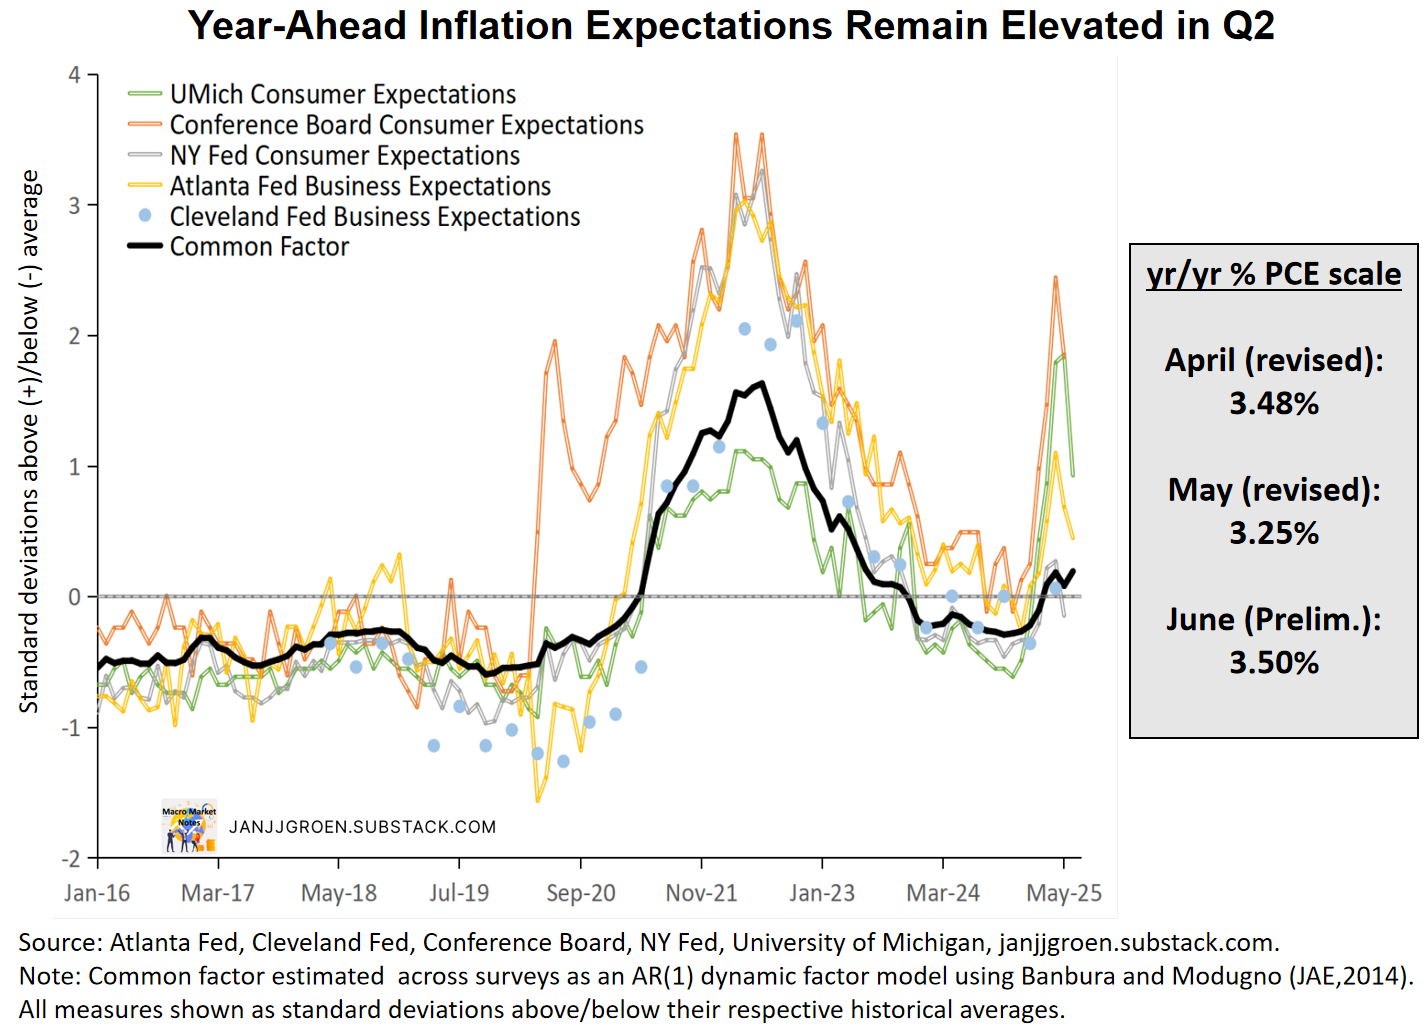
Based on updated survey data going into May as well as June for the preliminary University of Michigan Consumer Sentiment and the Atlanta Fed Business Inflation Expectations surveys, this measure of ‘Main Street’ year-ahead inflation expectations accelerated throughout since March to above 3% with the preliminary June reading at 3.5% in year/year PCE inflation terms. It’s not as high as my previous estimates, as consumer sentiment data in particular improved recently, but it’s still elevated compared to the start of the year.
Key to assessing the restrictiveness of these one-year real rates is where neutral real rates are heading. I assess these based on a range of R* estimates, both model-based (such as Laubach-Williams) as well as market data based, and based on updated data the average and median across these proxies remained relatively stable around 1.4% and 1.3% respectively in June, above the median 1% rate from the Fed’s March SEP.

The chart above compares the one-year survey-based real interest rate with the R* range across the various market- and model measures as a perceived policy stance measure. It suggests that the Fed’s stance is expected to be somewhat accommodative in inflation-adjusted terms between now and June 2026 (around 80bps and 70bps below the average and median R*’s respectively) despite using higher R*’s compared to the Fed.
Most of the expected stance easing, of course, is owing to the firming in near-term “Main Street” inflation expectations mentioned earlier. Most Fed officials have expressed in public remarks their desire to keep rates on hold while assessing recent inflation trends and the uncertainty regarding new policy initiatives out of D.C., but with a lot of easing in the perceived monetary policy stance due to a pickup in inflation expectations this will not be welcomed by most Fed officials

So, overall developments in the economy since the May meeting as well as a big emphasis on a cautious rate outlook in Fed officials’ statements likely means that the FOMC will keep its Fed funds target again unchanged in the 4.25%-4.5% range at its June meeting. This meeting will also see an update of the Summary of Economic Projections (SEP). I don’t think that the unemployment projections for 2025 and 2026 in table above will be revised. Similarly, growth projections will likely not change meaningfully, after notable downgrades in the previous SEP.
Based on the May CPI and PPI reports consensus expects May month/month core PCE inflation to come in at 0.14%, which would bring year/year core PCE inflation at 2.6%. With these prints the March SEP central tendency core PCE inflation projection of 2.7%-3% in 2025 would be attainable if from now on until the end of 2025 the month/month core PCE inflation on average would be around 0.25%. If the average month/month rate over the remainder of the year instead hits 0.3%, Q4/Q4 2025 core PCE inflation would hit 3.2%
Given that we likely haven’t seen the full extent of forthcoming tariff hikes on retail prices 0.25%-0.3% average month/month core PCE inflation rates should be a realistic outcome. Based on this I don’t think the 2025 SEP core PCE inflation projection will be revised much from a median of 2.8% (see the above table); the corresponding central tendency might be shifting up modestly though. It’s more likely that the 2026 core PCE inflation projection would be upgraded further, likely from a 2.2% median to 2.3%.
To summarize, in terms of the economic projections I expect the following updates to the SEP:
No material changes to the labor market outlook and GDP projections.
Slight upgrades to the central tendency of the 2025 core PCE inflation outlooks and an upgrade in the 2026 median from 2.2% to 2.3%.
Guidance regarding future policy rate changes will in my opinion not change much when the FOMC updates its SEP at the June meeting. As noted earlier, a variety market- and model-based still point to a higher R* than the Fed’s own view: 1.2%-1.4% vs 1%. I expect the Fed to continue to incrementally increase its long-run Fed funds rate level over the next couple of meetings, and in this SEP update I expect it to go from 3% to 3.1%.
With the one-year Treasury rate averaging at 4.1% over the first half of June, market pricing is broadly consistent with the projected two rate cuts in 2025 from the March SEP and I think the June SEP will continue to project two Fed funds rate cuts for 2025.
While the current ‘hard’ data, through the earlier discussed policy rules, indeed suggests the Fed funds rate is at a level where the Fed is well positioned relative to underlying fundamentals, the fact that rising inflation expectations is seemingly making the Fed’s policy stance less restrictive should be notable. I expect the post-meeting remarks to continue to emphasize the role of inflation expectations in shaping the Fed’s response to new policy initiatives and the fallout to the rest of the economy.
For more detail about the different policy rate rule variants that are used in this exercise, see the box at the end of my post-September FOMC post. The only difference compared to that note is that I now not only use the central tendencies for the long-run Fed fund and unemployment rates from the history of SEPs, but in addition also the maximum and minimum for these long-run values. This gives a more complete picture of how the distribution of beliefs evolved within the FOMC. As a result of this addition, the total number of policy rule variants from increases from 1200 to 3600.
Enjoyed every but of the article!